Investment briefing
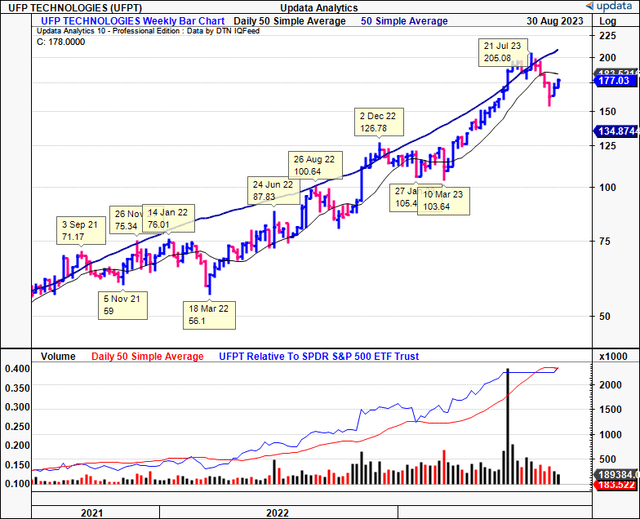
UFP Technologies, Inc. (NASDAQ:UFPT) continues to present with compelling long-term value in my informed opinion. The company’s rally from 2022 extended to mid-July and the equity line has since rolled over, in line with the sharp selloff in broad healthcare in the same month. Since the last publication, there are a number of investment updates in need of discussion.
Critically, when squaring off the economic characteristics of UFPT’s business growth the company is creating tremendous value for long-term equity holders. It had deployed $44/share in business capital last period to produce $6.90/share in trailing NOPAT, 14.5% return on investment. This percentage has grown every consecutive period from 2022—2023. As far as compounders go, the company’s operating assets are pulling their economic weight, and investors now have the opportunity to allocate at a firm producing 2–3% in economic profits above the 12% long-term market return on capital. This is the kind of business we relish and look to position outsized weightings against in our equity risk budget.
Going forward, my calculus calls for the company to sell at an EV of $2.5Bn over the coming 12–24 months, a 72% value gap from the current market price. This supports a buy rating, and here I’ll cover all the investment updates and moving parts investors need to know for the UFPT investment debate. Net-net, reiterate buy.
Figure 1. UFPT weekly equity line, log scale, with respective highs & lows
Data: Updata
Critical facts to reiterated buy thesis
Brief overview of operations
UFPT is in the business of custom design and manufacturing. It has a footprint in several markets, but specializes in medical devices—this is why it’s on our radar. The company is positioned uniquely along the medical devices value chain. It provides a manufacturing link to some of the larger medical instruments and supplies players around the globe. It also has a presence in markets for sterile packaging and engineered custom products.
The company’s extensive portfolio includes single-use and single-patient devices/components that are used within various medical applications (think minimally invasive surgery, infection prevention, orthopedic implants, and so forth). Still, it also manufactures custom mouldings for industrial applications, ranging from engine/manifold covers to knee pads and helmets to protective packaging, just to name a few.
This kind of business attracts me, i.e., the diversified manufacturing business. Given its exposure to several markets, UFPT’s top-line is hedged against large sigma events that could otherwise hurt more concentrated players. Still, its medical devices segment makes up ~85% of revenues, and so this is where I am most aligned with the company for our core holdings.
1. Q2 earnings insights
UFPT clipped a 6% YoY increase in sales and put up $100mm for the quarter on core EBITDA of ~$20mml, up 27% YoY. For the YTD, sales were up 19.4% on H1 last year, pulling to c.$198mm.
Positive sales trends were observed across its various markets, with the medical sector driving a 16% growth to $86.15mm. The remainder of the portfolio put up the following numbers:
- The aerospace & defense (“A&D”) segment grew 12.9% YoY to $4.3mm and made up ~4.2% of quarterly sales. This is up 20bps on last year. H1 revenues in A&D came to $8.7mm.
- Its automotive business experienced a modest decline of 5.9% and made up only 4.1% of Q2 turnover, down roughly 50bps, and 100bps on H1 last year.
- Conversely, sales in all other categories—including consumer, electronics, and industrial—witnessed a sharp decrease of 53.4%. They contributed 5.6% of revenues, well off the 12.7% last year. Sales in the ‘other’ segment were down ~$12mm in H1 from H1 FY’22.
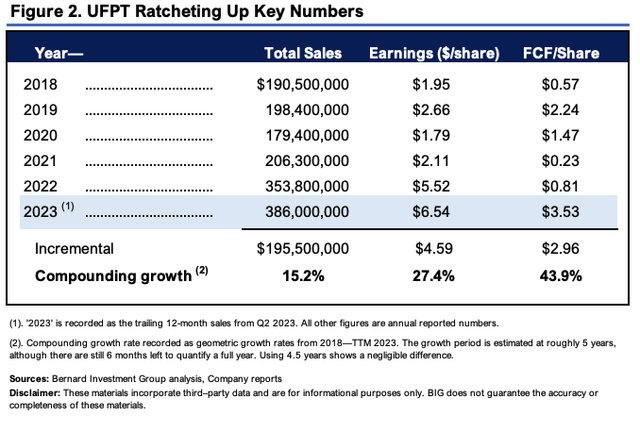
Critically, the mixture of growth percentages hasn’t put UFPT off course. It continues to create value for shareholders in many ways. As evidence of the earnings and FCF leverage UFPT has produced for shareholders, Figure 2 outlines the growth in financials consolidated to a per-share basis. Annual numbers are shown, with 2023 recorded as the TTM to Q2 2023. Free cash flow in this example is considered FCF to the firm (“FCFF”), and includes all cash diverted to acquisitions and other operating measures.
Whilst it has compounded sales at a 15% annual rate, it has grown earnings at a compounding growth rate of 27.4% and FCFF per share at ~44% from 2018–2023 TTM. You’re looking at an additional $4.60 in earnings and $2.96 in FCFF/share off ~$25/share in revenue growth. The leverage on this suggests that for every $1 in new revenue since 2018, the company has produced $1.80/share in earnings and $2.88/share in FCFF—attractive economics in my view.
BIG Insights
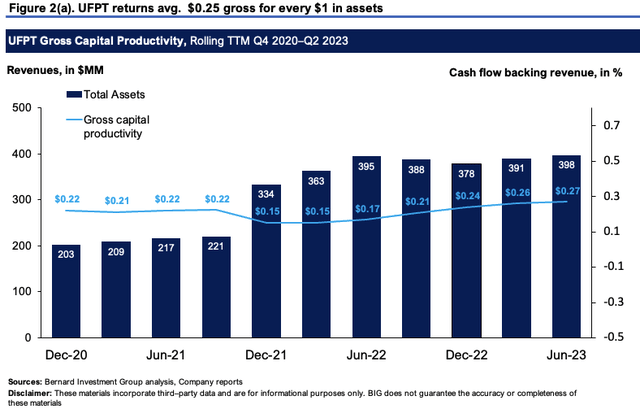
Moving down the P&L, the firm decompressed ~300bps off its gross margin and clipped 29.6% as a percentage of revenues for the quarter. As a percentage of assets, Figure 2a shows the company returned $0.27 for every $1 tied up in asset value, above the $0.25 2-year average, and the $0.22 on the dollar in 2020.
It also lost ~180bps of leverage at the SG&A line but gained this back at the margin, with SG&A as a percentage of sales falling to 12.3% from 12.8% last year. It pulled these numbers down to quarterly operating profit of $17mm.
BIG Insights
2. Economic growth levers
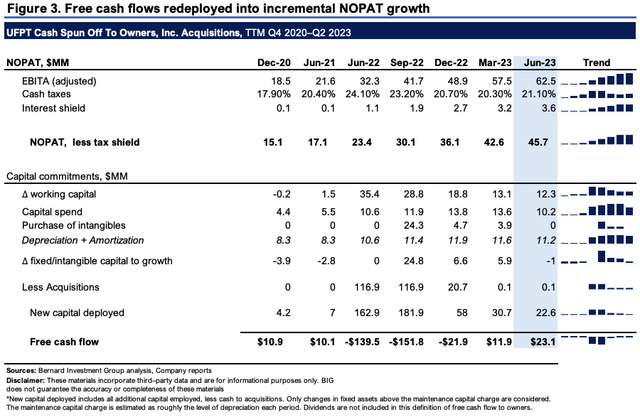
I talked at lengths of the value UFPT is creating for shareholders in the last publication. Here I’ve taken it a step further, demonstrating how the company is recycling surplus capital into additional investments and growth in economic and owner earnings (note: FCF is interchangeable with owner earnings in Figure 3, in contrast to FCFF discussed earlier).
Figure 3 depicts the free cash flow attributable to shareholders on a rolling TTM basis from 2020–2023. All cash diverted to acquisitions is factored in. Only CapEx above the maintenance capital charge is considered as growth investment. The maintenance charge is considered to be roughly in line with depreciation/amortization each period.
The following critical observations are made:
- Earnings after-tax (NOPAT) has grown from $15mm to $45.7mm in the TTM, a $30mm incremental gain.
- At the same time, NWC requirements have fallen from $35mm in 2022 to $12mm last period to produce the growth levels outlined. The same is observed with fixed asset additions.
- Most importantly, the company spun of $23mm in cash to shareholders in the TTM, a 100% increase from 2020. Adjusting for acquisitions, this is also up from $3.5mm at the end of 2022.
This equates to a tasty equation: more cash spun off to equity holders on smaller incremental capital requirements. The leverage UFPT can produce on capital deployed is therefore attractive. It grew TTM FCF $11.2mm off a $22.6mm investment rolling from Q1 FY’23 to Q2 FY’23 as clear evidence of this.
BIG Insights
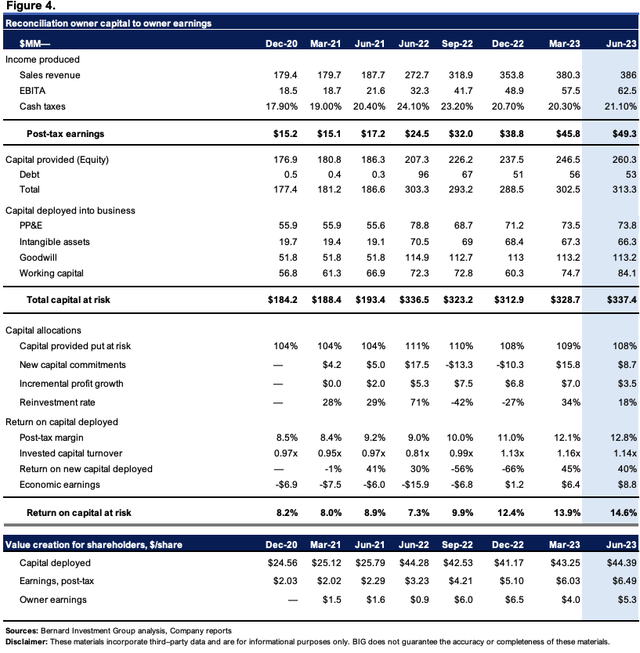
A more granular reconciliation of the investor capital to owner and economic earnings produced is outlined in Figure 4.
This depicts how the firm is creating value 1) in excess of the capital it has deployed into its operations, and 2) the return investors require to provide additional capital to the company. I call this ‘economic leverage on capital deployed’. Investors have indeed provided UFPT with $260mm in capital (debt, equity) as of Q2 FY’23. UFPT has put 108% of this at risk into the business, $337mm in total.
The $337mm in capital produces $49.3mm in post-tax earnings, compared to $24.5mm produced on $336mm in Q2 FY’22. This equates to $44.4/share producing ~$6.50/share for shareholders, otherwise 14.6% return on investment.
This is tremendous leverage, with an additional c.$20mm produced off just $1mm of additional capital at risk. Most critically, the level of trailing return on capital deployed has increased each period since Q2 2022. All of this was down with just $53mm in debt on the balance sheet by the way.
You’ll also note the company’s economic earnings—those earnings produced above the 12% hurdle rate used here—have entered into positive territory, at $8.8mm last quarter, or 2.6% of the capital employed into the business. These are increasing too, and I’d be looking to this as a platform for UFPT to generate $12–$15mm in economic earnings this year.
These are tremendously attractive economics, that square off to suggest UFPT can continue to sell higher in my view and set the stage for another period of strong growth ahead.
BIG Insights
3. Valuation
The stock sells at 30x forward earnings and 18x forward EBITDA. These are both premiums to the sector of 50% and 38%, respectively, so the question turns to what the symmetry of upside/downside is from here. I’m okay with a company trading ahead of peers provided the economics are squared off and supported in its ability to compound its intrinsic value. A firm can do this at the function of its returns on capital invested and the amount it reinvests at these rates.
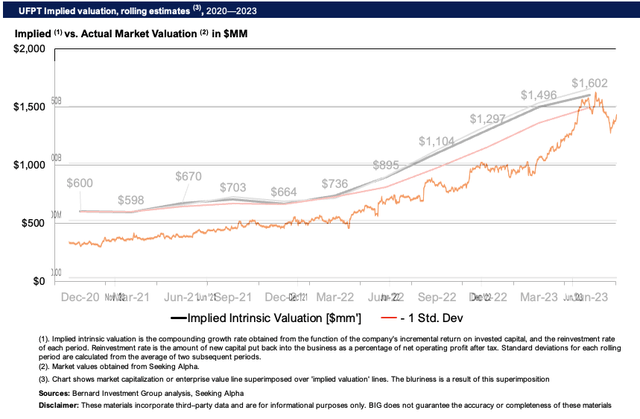
Applying this calculus to UFPT’s equity line (shown as enterprise value in Figure 5) suggests the company is valued fairly at an EV of $1.6Bn. Note, it was trading below the implied market value line for the last 2 years. It nudged the fair value estimate last month, so it wasn’t surprising to see it sell lower in the subsequent weeks.
Over the long-term, a corporation’s market value will tend to snake around the implied intrinsic valuation estimate. I’d call for UFPT to sell at $1.6Bn EV by yearend, provided it spins off the same percentages of earnings off the capital deployed into the business.
Figure 5.
BIG Insights
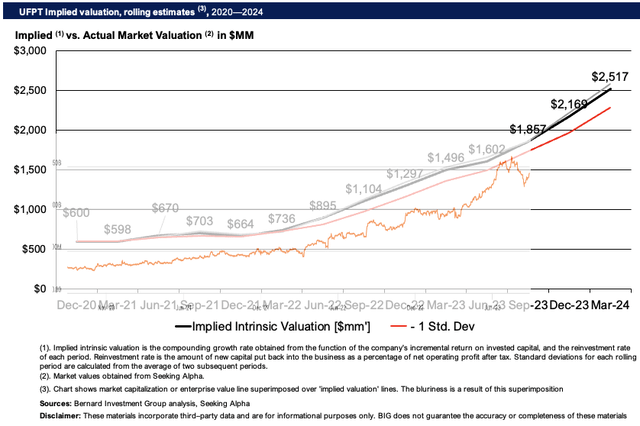
Extending the assumptions out to FY’24, I get to $2.5Bn in EV, with an average 16% compounding growth rate in intrinsic value. This supports a buy rating in my view.
Figure 6.
BIG Insights
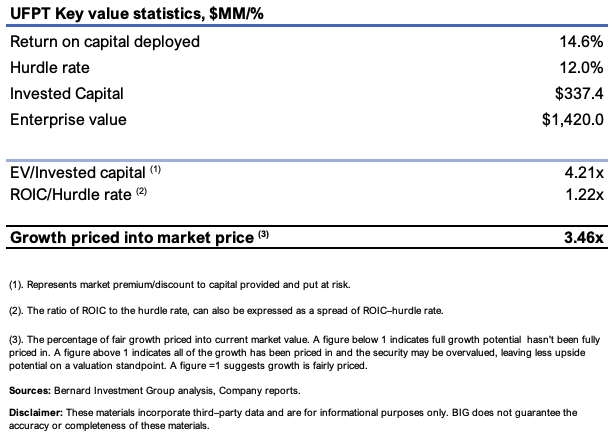
The risk is how much of the growth potential is already priced in. Figure 6 details this well. At a $1.4Bn EV, UFPT trades at 4.2x invested capital. Note that a multiple >1 is desirable, as it implies:
1) The market values the company’s investments highly (in what they can produce);
2) That investors expect UFPT to continue spinning off high amounts of cash to its shareholders;
3) UFPT has created immense value from the capital it has employed into operations—more than $4.20 in market value for every $1 invested.
Further, the ratio of ROIC to the 12% hurdle rate used within our portfolios exemplifies this further, at 1.22x (again, >1 is preferred).
I use the ROIC/12% ratio as a sort of ‘zero-growth’ proxy of the EV/IC multiple, to observe what is and isn’t priced in. It would appear the market has baked in ~245% of the economic value UFPT can produce at its historical rates.
Therefore, and again, a pullback off the previous highs isn’t a concern based on these economic factors. It could pull back to an EV of $450 and still remain attractive in my view. Anything below this would be an enormous plus—but the distribution of probabilities places little weight on UFPT selling at that level.
Nevertheless, these numbers are still bullish over the long-run in my opinion, especially as UFPT continues to ratchet up the value chain.
Figure 7.
BIG Insights
In short
UFPT is the kind of business that is compounding its intrinsic value at a steady clip, thus unlocking sustainable value for its owners. The firm’s economic characteristics are a standout and suggest capital is valuable in its hands. More valuable than in our own hands, as it would appear. The firm did $6.90/share in earnings after-tax off $44mm/share invested, ~14.5% return on investment over the 12 months to Q2 FY’23. This has been ratcheting up over the last 2 years as well. In my eyes the company is worth $1.Bn in EV today and thus a pullback in the price line doesn’t concern the long-term thesis here.
Read the full article here


