Record QT and big rate hikes no problem: Corporate Bond Market Distress Index drops to lowest level since before the Fed started tightening.
The New York Fed’s update on Wednesday of its weekly Corporate Bond Market Distress Index (CMDI) shows just how much liquidity there is still sloshing around from years of mega QE, and how yield-chasing has resurged this year, despite the Fed’s hiking its policy rates to the highest levels in 22 years and despite the biggest QT ever.
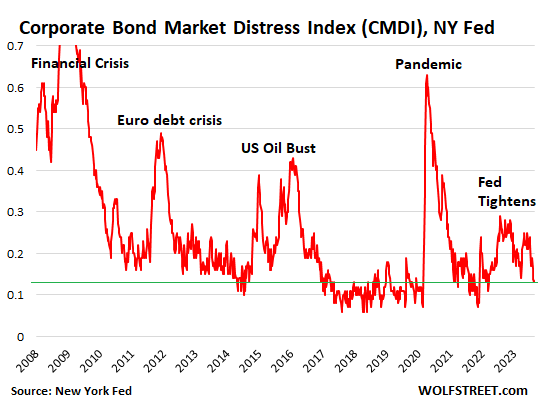
This index of distress in the corporate bond market, after spiking early in the tightening cycle, fell to 0.13 over the past two weeks, the lowest level since before this tightening cycle began:

“The index identifies as ‘distress’ periods during which a large number of individual measures of market functioning indicate deteriorating conditions in both the primary and the secondary markets for corporate bonds,” the New York Fed says.
“Corporate bond market functioning appears healthy. The end-of-month market-level CMDI is below its historical 20th percentile,” the New York Fed says.
“Market functioning in both the high-yield and investment-grade sectors improved during the course of August,” the New York Fed says.
In other words, after some initial wavering, the corporate bond market has easily adjusted to the much tighter monetary policies and returned to la-la-land.
One reason to track distress is to see how far the Fed can go with its tightening before it does some real damage to the corporate bond market. And the index shows that compared to the other moments of damage – even the lesser ones of the Euro debt crisis and the US Oil Bust – there hasn’t been any damage. The index is now back in its historical comfort zone.
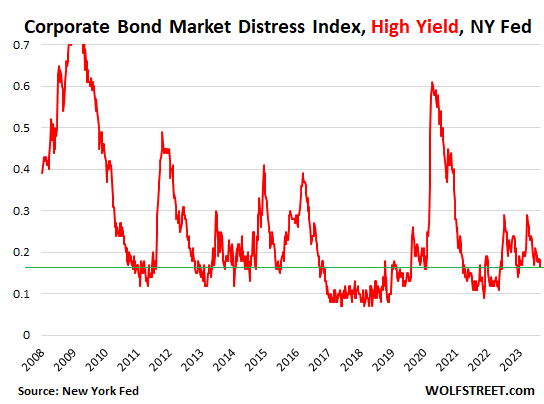
Even the junk bond market remains in its comfort zone. The New York Fed also provides the sub-indices for distress in the investment grade segment and in the junk-rated (high yield) segment of the corporate bond market.
The High Yield CMDI tracks junk bonds that are rated BB+ and below but above CCC/C, so not including the low end of the junk bond market (here is my table of corporate bond credit ratings by ratings agency).
This High Yield CMDI fell to 0.16 this today, and after the two brief spikes has returned to its comfort zone:

To deal with the worst inflation in 40 years, the Fed has attempted to “tighten” financial conditions with rate hikes and QT. Tighter financial conditions would make borrowing for companies and consumers harder to get and more expensive, and would create a little more distress among borrowers, especially those with weaker credit, such as junk-rated companies, and would therefore reduce investment and demand in the economy and thereby remove some inflationary pressures. So the theory goes.
During this tightening cycle, the New York Fed came up with the CMDI to track the effects of this tightening on the corporate bond market. It complements a whole slew of indices attempting to measure financial stress, but is specifically addressing distress in the corporate bond market.
And at first, the effects were as promised: In late 2021, when the Fed started talking about tapering, rate hikes, and QT, financial distress in the corporate bond market began to rise from historically low levels, in anticipation of what might come.
By November 2022, with rate hikes and QT in full swing, the CMDI had risen to 0.28, the highest level since November 2020, when it was coming down from the lockdown shock.
But since then, it has wobbled lower, showing that there is now less distress in the corporate bond market than before the Fed even started tightening.
The CMDI includes primary market measures from the Mergent Fixed Income Securities Database (FISD), such as issuance volumes, primary market pricing, and issuer characteristics.
It includes secondary market measures, such as trading data from TRACE, and measures that reflect central tendencies and other aspects of the distributions, of volume, liquidity, nontraded bonds, spreads, and default-adjusted spreads. And it includes quoted prices from ICE Bank of America to track the differential secondary market conditions for traded and non-traded bonds.
Original Post
Editor’s Note: The summary bullets for this article were chosen by Seeking Alpha editors.
Read the full article here


