By Sandrine Soubeyran and Robin Marshall, Global Investment Research, FTSE Russell
Euro high yield (HY) credits have outperformed Euro investment grade (IG) corporate bonds, and those of other regions, both in July and since the beginning of the year.
The FTSE Euro High Yield Bond index was up 1.3% and 6.5% respectively in July, and year-to-date, compared to 1.0% and 3.4% for the IG equivalents, while credits in other regions were modestly higher or lower. So why did Euro high yield credit outperform, and can this outperformance continue?
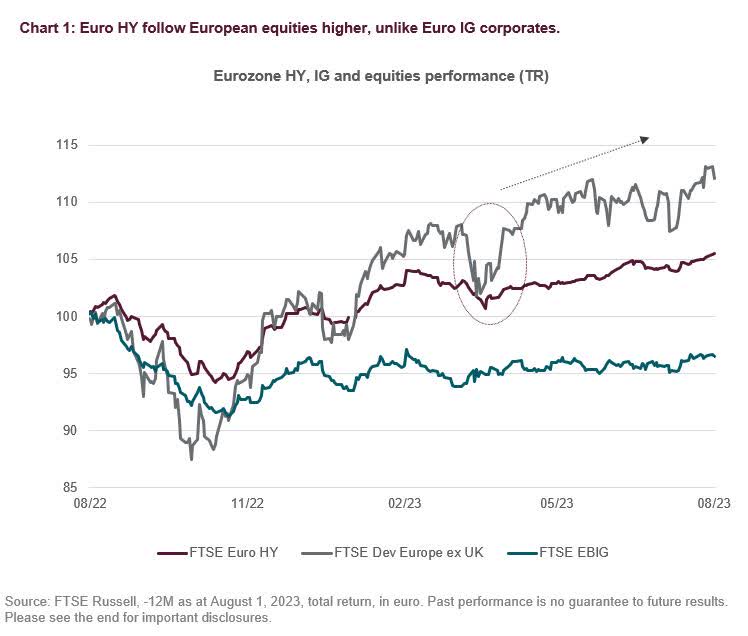
Chart 1 shows Euro high yield bonds have followed Eurozone equities higher over the last twelve months, with much of the increase seen since Q2 2023, while the performance of investment grade corporate bonds was more subdued.
Credit rallied for a number of reasons, renewed optimism over early central bank pivots, more confidence in a soft landing for growth and inflation, low default rates and increased risk appetite.
Also, both the US Fed and Swiss SNB intervened to calm markets, and reduce systemic risks, after the collapse of Silicon Valley Bank, and Credit Suisse (CS) in Europe, upgrading depositor protection, and providing emergency liquidity.
The Swiss authorities’ decision to “bail-in” Contingent Convertible bond holders, or Cocos, added pressure on high yield debt markets since equity holders in Credit Suisse were treated more favourably than Coco bondholders in the resolution. But contagion has proved limited, helped by higher Eurozone bank Tier 1 capital ratios.
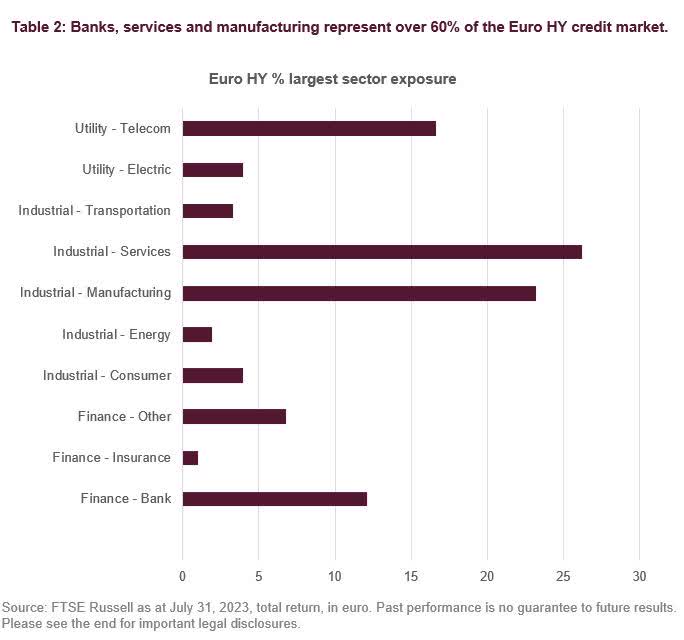
The FTSE Euro high yield bond market has a sizeable exposure to banks (12%) and with other financials, they account for a weight close to 20% as Table 2 shows.
Moreover, the next two largest industries, manufacturing and services represent a weight of over 20% and 25% respectively. While manufacturing has slowed within the Eurozone, services have remained robust, underpinned by post-Covid recoveries in consumer demand in sectors like tourism and travel.
Shorter duration has also offered investor protection in high yield indices
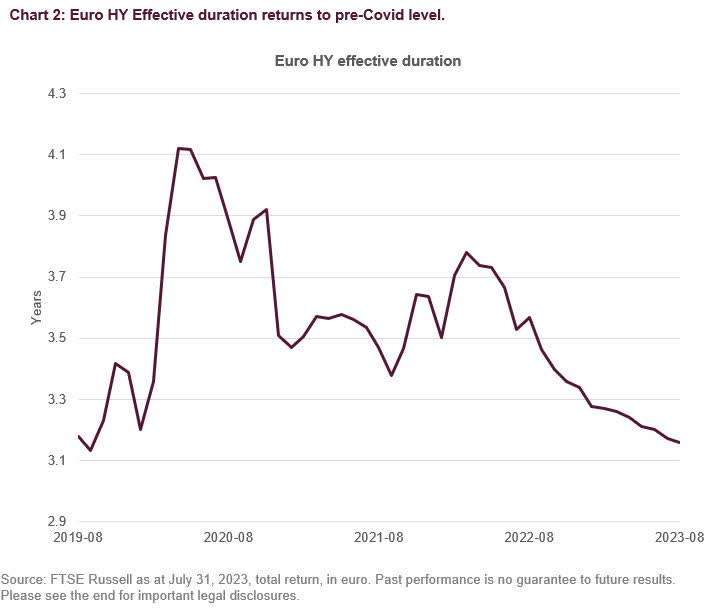
High yield credit issuers are rarely able to borrow in longer maturities, so HY indices tend to have shorter duration than IG indices. HY index duration proved volatile in the early days of Covid, as HY credits first fell sharply in price on risk-aversion and default fears, before rallying after the ECB began QE programmes, and eased financial conditions through its bank LTROs.
Overall, as Chart 2 illustrates, the effective duration for the FTSE Euro High Yield Bond index fell from about four years in 2020 to close to its pre-Covid level of about three years.
But HY issuance in Euros has been generally very low since Covid, as companies have often substituted bank finance, at more favourable terms. The maturity profile and duration of Eurozone HY debt has also shortened as a result.
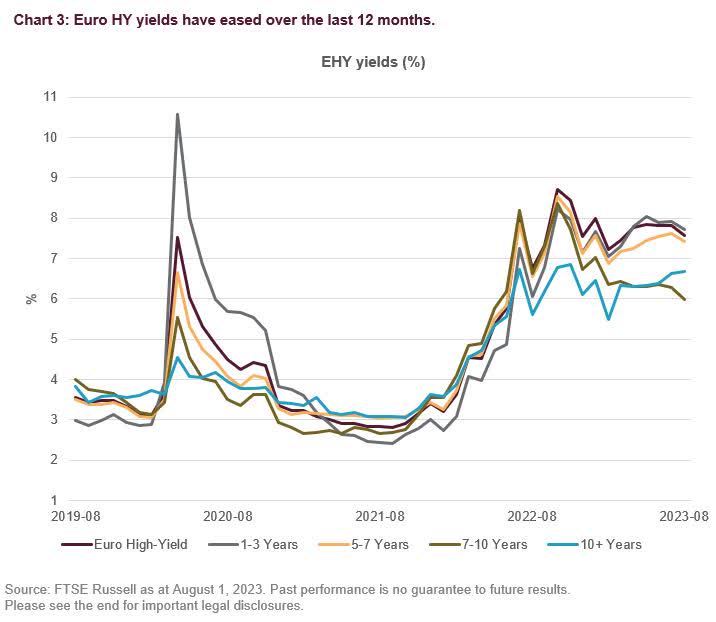
A further breakdown of the Euro HY performance across the curve shows yields declining in most maturities over the last year, with the 5-7-year section dropping the most, from 8% to about 6%.
Even so, yield levels for Euro HY are still high, and higher than during the Covid spike. Only the 1-3-year area, which was close to 11% has fallen to about 8%. The longest part of the curve, the 10-year plus, while stable over the last twelve months, has seen the least yield compression since 2020 (Chart 3).
Despite the higher yields, credit defaults, while rising, have remained relatively modest this year. According to S&P Global Ratings, the number of defaults in Europe fell from seven to six since January[1].
Meanwhile, European default rates are expected to rise “to 4.25% in the US and 3.6% in Europe by spring 2024”[2], notably in the more speculative end of the market.
However, comparing and projecting default rates with previous credit cycles may not be a reliable metric, given that default rates are also driven by covenants within bond prospectuses, and investor protection covenants have tended to weaken since the GFC.
Credit quality of HY indices has improved as share of BB-rated securities increased
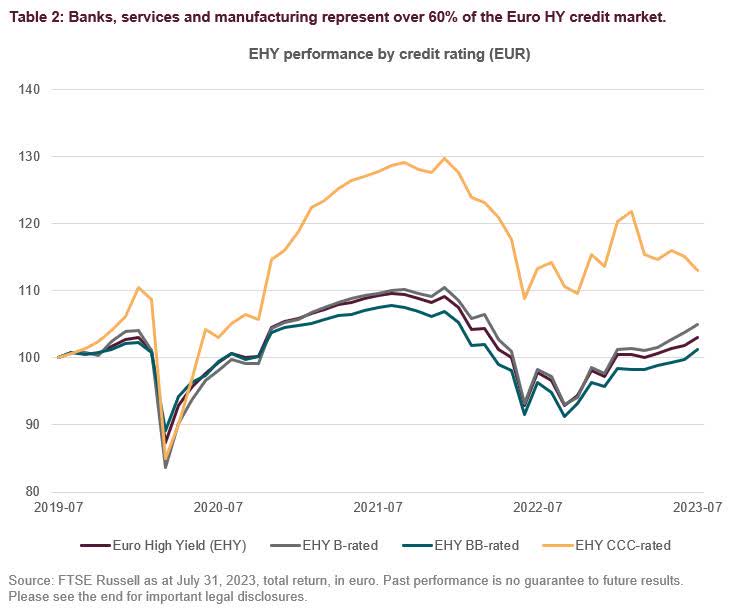
Looking instead at the performance of different rating buckets within high yield, lower rated CCC securities have underperformed, as Chart 4 shows, and much of the positive performance came from the higher quality BB-B securities, which make up 76% of the FTSE Euro High Yield Bond index exposure.
The higher share of BB-rated securities in HY indices reflects the impact of rating downgrades, in some cases “fallen angels”, which have migrated from IG to HY. But this has improved the overall credit quality of HY indices.
[1] S&P Global Ratings: Credit Market Research | S&P Global Ratings (spglobal.com).
[2] S&P Global Ratings: Credit Conditions | S&P Global Ratings | S&P Global Ratings (spglobal.com).
© 2023 London Stock Exchange Group plc and its applicable group undertakings (the “LSE Group”). The LSE Group includes (1) FTSE International Limited (“FTSE”), (2) Frank Russell Company (“Russell”), (3) FTSE Global Debt Capital Markets Inc. and FTSE Global Debt Capital Markets Limited (together, “FTSE Canada”), (4) FTSE Fixed Income Europe Limited (“FTSE FI Europe”), (5) FTSE Fixed Income LLC (“FTSE FI”), (6) The Yield Book Inc (“YB”) and (7) Beyond Ratings S.A.S. (“BR”). All rights reserved.
FTSE Russell® is a trading name of FTSE, Russell, FTSE Canada, FTSE FI, FTSE FI Europe, YB and BR. “FTSE®”, “Russell®”, “FTSE Russell®”, “FTSE4Good®”, “ICB®”, “The Yield Book®”, “Beyond Ratings®” and all other trademarks and service marks used herein (whether registered or unregistered) are trademarks and/or service marks owned or licensed by the applicable member of the LSE Group or their respective licensors and are owned, or used under licence, by FTSE, Russell, FTSE Canada, FTSE FI, FTSE FI Europe, YB or BR. FTSE International Limited is authorised and regulated by the Financial Conduct Authority as a benchmark administrator.
All information is provided for information purposes only. All information and data contained in this publication is obtained by the LSE Group, from sources believed by it to be accurate and reliable. Because of the possibility of human and mechanical error as well as other factors, however, such information and data is provided “as is” without warranty of any kind. No member of the LSE Group nor their respective directors, officers, employees, partners or licensors make any claim, prediction, warranty or representation whatsoever, expressly or impliedly, either as to the accuracy, timeliness, completeness, merchantability of any information or of results to be obtained from the use of FTSE Russell products, including but not limited to indexes, data and analytics, or the fitness or suitability of the FTSE Russell products for any particular purpose to which they might be put. Any representation of historical data accessible through FTSE Russell products is provided for information purposes only and is not a reliable indicator of future performance.
No responsibility or liability can be accepted by any member of the LSE Group nor their respective directors, officers, employees, partners or licensors for (A) any loss or damage in whole or in part caused by, resulting from, or relating to any error (negligent or otherwise) or other circumstance involved in procuring, collecting, compiling, interpreting, analysing, editing, transcribing, transmitting, communicating or delivering any such information or data or from use of this document or links to this document or (B) any direct, indirect, special, consequential or incidental damages whatsoever, even if any member of the LSE Group is advised in advance of the possibility of such damages, resulting from the use of, or inability to use, such information.
No member of the LSE Group nor their respective directors, officers, employees, partners or licensors provide investment advice and nothing in this document should be taken as constituting financial or investment advice. No member of the LSE Group nor their respective directors, officers, employees, partners or licensors make any representation regarding the advisability of investing in any asset or whether such investment creates any legal or compliance risks for the investor. A decision to invest in any such asset should not be made in reliance on any information herein. Indexes cannot be invested in directly. Inclusion of an asset in an index is not a recommendation to buy, sell or hold that asset nor confirmation that any particular investor may lawfully buy, sell or hold the asset or an index containing the asset. The general information contained in this publication should not be acted upon without obtaining specific legal, tax, and investment advice from a licensed professional.
Past performance is no guarantee of future results. Charts and graphs are provided for illustrative purposes only. Index returns shown may not represent the results of the actual trading of investable assets. Certain returns shown may reflect back-tested performance. All performance presented prior to the index inception date is back-tested performance. Back-tested performance is not actual performance, but is hypothetical. The back-test calculations are based on the same methodology that was in effect when the index was officially launched. However, back-tested data may reflect the application of the index methodology with the benefit of hindsight, and the historic calculations of an index may change from month to month based on revisions to the underlying economic data used in the calculation of the index.
This document may contain forward-looking assessments. These are based upon a number of assumptions concerning future conditions that ultimately may prove to be inaccurate. Such forward-looking assessments are subject to risks and uncertainties and may be affected by various factors that may cause actual results to differ materially. No member of the LSE Group nor their licensors assume any duty to and do not undertake to update forward-looking assessments.
No part of this information may be reproduced, stored in a retrieval system or transmitted in any form or by any means, electronic, mechanical, photocopying, recording or otherwise, without prior written permission of the applicable member of the LSE Group. Use and distribution of the LSE Group data requires a licence from FTSE, Russell, FTSE Canada, FTSE FI, FTSE FI Europe, YB, BR and/or their respective licensors.
Original Post
Read the full article here


