Fundamentals
Wrapping up this week, let’s reflect on the key market insights and data that influenced gold prices and related assets over the past five days.
Despite the FOMC’s strong stance this summer at Jackson Hole, gold ended the day on a downward note but maintained a positive weekly trend, staying above its recent resistance level.
From August 21-25, gold’s dynamics were largely influenced by market perceptions of the Fed’s policy direction, more so than any other week in 2023. This is attributed to the quiet summer period combined with the influential Jackson Hole Symposium. The most pivotal event was on Friday, when Jerome Powell spoke at Jackson, presenting views that were negative for gold. However, considering the week’s entirety, it’s crucial to consider trading activities before this address.
The Jackson Hole Symposium, unlike regular FOMC meetings, carries an element of unpredictability. This sense of uncertainty played favorably for the gold market. Many had expected hawkish sentiments from the Fed, yet there were clear signs of market hesitation. This was evident in the weakening US Dollar and falling US Treasury Yields throughout the week, providing room for gold prices to ascend. By Thursday, gold’s value peaked near $1915, marking a significant uptrend.
On Friday, influenced by the Fed’s remarks on inflation and other market responses, gold prices saw a dip. Yet, the consistent gains from earlier in the week cushioned this fall, and gold settled around $1913/oz.
Overall, it was a positive week for gold. The potential for further growth will be watched closely next week, especially with the upcoming August Jobs Report.
Gold Market Analysis for the Week:
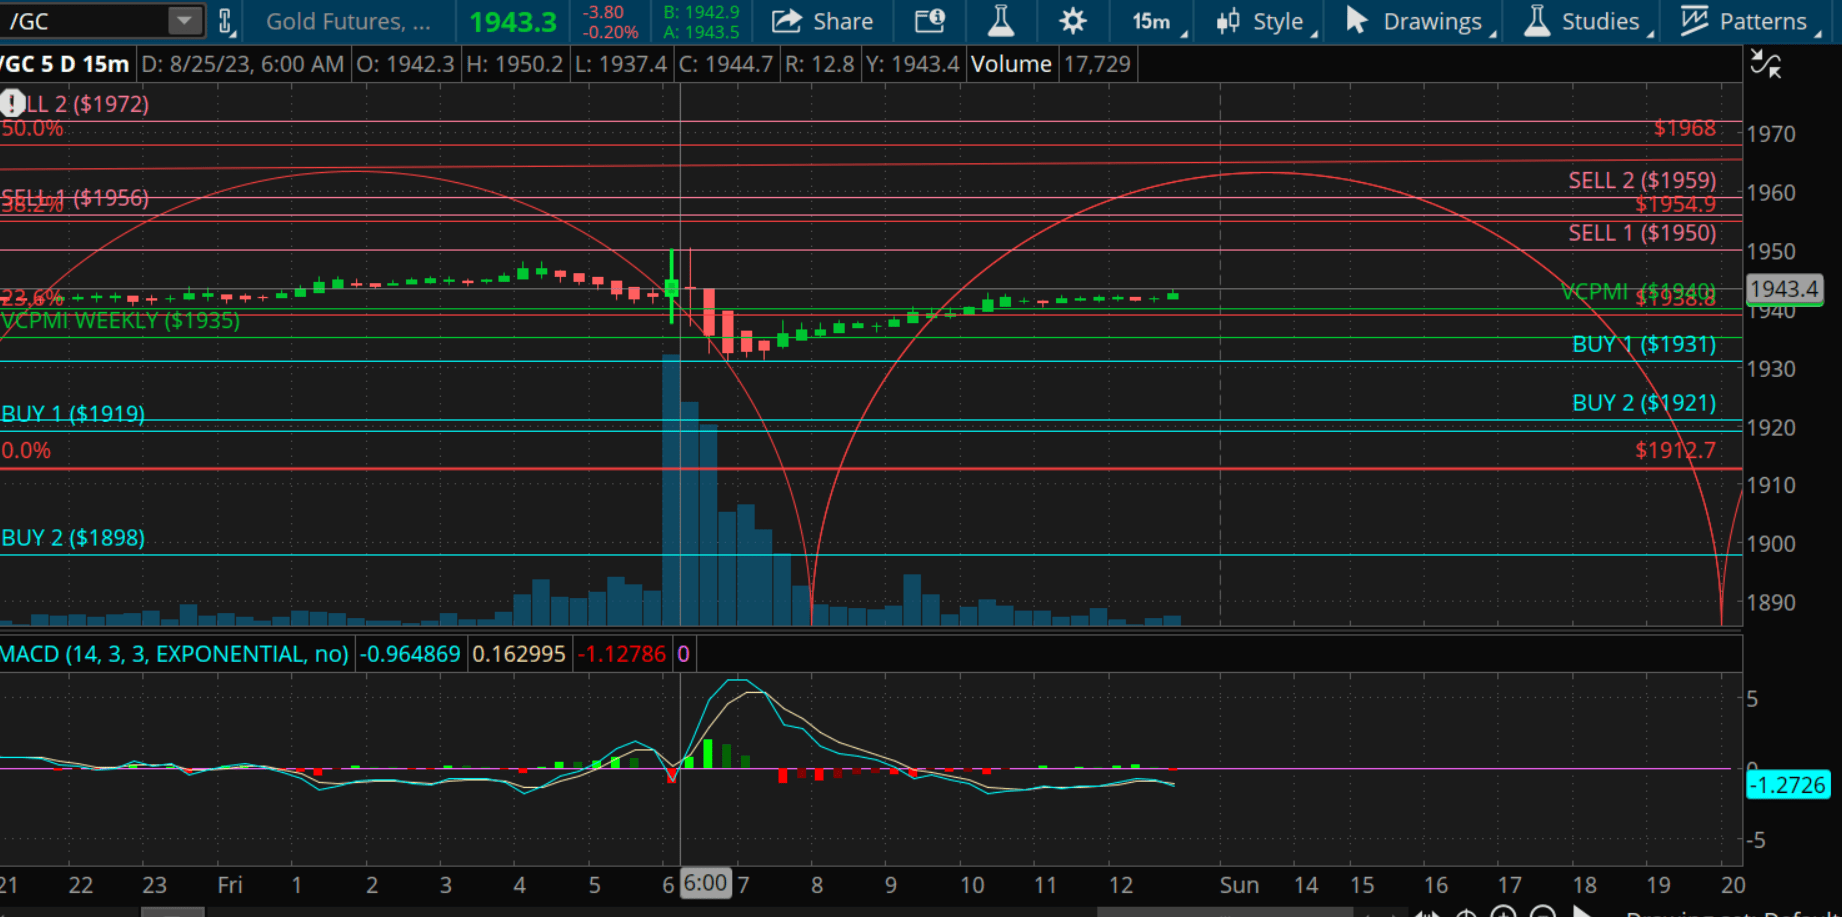
On 8/21, gold prices experienced a dip, reaching a low of $1913.60. However, the metal quickly bounced back, surpassing the weekly average of $1926. This rapid turnaround activated a buy signal. With this momentum, the market anticipated targets ranging between $1939 to $1960 for the week.
As the week progressed, the $1939 target was achieved, and gold peaked at an impressive $1950.4 by 8/25. This shift suggests that a market reversion has taken place.
The current trend, combined with standard deviation, hints at the potential of gold to reach the 61.8% Fibonacci retracement level, often referred to as the “golden ratio”. This sets a prospective target for gold at around $1981.
This movement aligns with the market’s respect for key Fibonacci levels, further emphasizing the importance of the 61.8% mark in trading and analysis. The near-term behavior of gold prices will be critical in validating this projection.
Let’s take a look at next week’s standard deviation report and see what short-term trading opportunities we can identify:
GOLD: Weekly Standard Deviation Report
Aug. 25, 2023 9:00 PM ET
Summary
- Gold futures market shows mixed trends, with bearish trend momentum and bullish price momentum.
- Traders advised to take profits during corrections between Buy 1 and 2 levels, and consider long positions with weekly reversal stop.
- Short position holders advised to take profits in range of 1919 to 1898, while long position holders recommended profit-taking range is between 1958 and 1972.
weekly gold (TOS)
Executive Summary: The gold futures market exhibited mixed trends this week, with bearish trend momentum but bullish price momentum. This report outlines the implications of these indicators and provides recommended actions for traders.
Weekly Trend Momentum: The gold futures contract closed this week at 1940. Significantly, the market’s closure below the 9-day SMA at 1970 confirms a prevailing bearish momentum for the week. A future closed above the 9-day SMA would move the momentum to neutral.
Weekly Price Momentum: Despite the trend momentum’s bearish tilt, the price momentum is distinctly bullish. This is evident with the market closure above the VC Weekly Price Momentum Indicator set at 1935. Should the market close below the VC PMI, we anticipate a shift to neutral in terms of price momentum.
Weekly Price Indicator Recommendations:
- Traders holding short positions are advised to consider taking profits during corrections that fall between the Buy 1 and 2 levels, specifically 1919 to 1972.
- For those considering a long position, they are encouraged to employ a weekly reversal stop. Furthermore, the level of 1935 should be established as a Stop Close Only with a Good Till Cancelled (GTC) order.
- Traders on the long side are advised to look into taking profits when the market achieves the Sell 1 and 2 levels, ranging between 1956 and 1972 over the week.
Cycle-Based Recommendations:
- Short position holders: It would be prudent to consider taking profits in the range of 1919 to 1898.
- Long position holders: The recommended profit-taking range is between 1958 and 1972.
In conclusion, traders should approach the market with a clear strategy informed by the outlined indicators and recommendations. Regular monitoring of the gold futures market is essential to navigate its dynamic nature effectively.
Read the full article here


