Welcome to another installment of our CEF Market Weekly Review, where we discuss closed-end fund (“CEF”) market activity from both the bottom-up – highlighting individual fund news and events – as well as the top-down – providing an overview of the broader market. We also try to provide some historical context as well as the relevant themes that look to be driving markets or that investors ought to be mindful of.
This update covers the period through the third week of August. Be sure to check out our other weekly updates covering the business development company (“BDC”) as well as the preferreds/baby bond markets for perspectives across the broader income space.
Market Action
It was another down week for CEFs as the market remained under pressure from falling stocks and Treasuries.
Systematic Income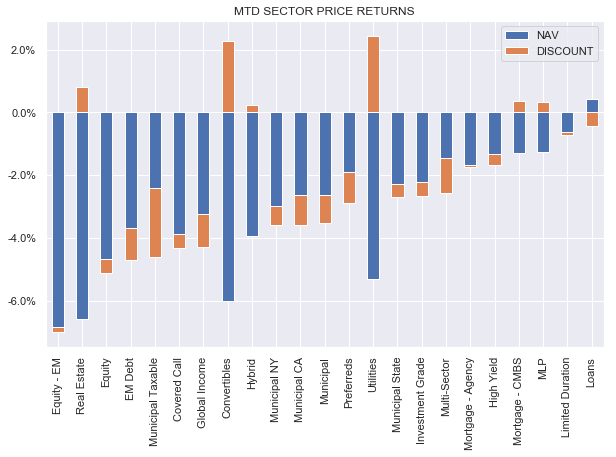
August has now erased the positive returns accrued over July.
Systematic Income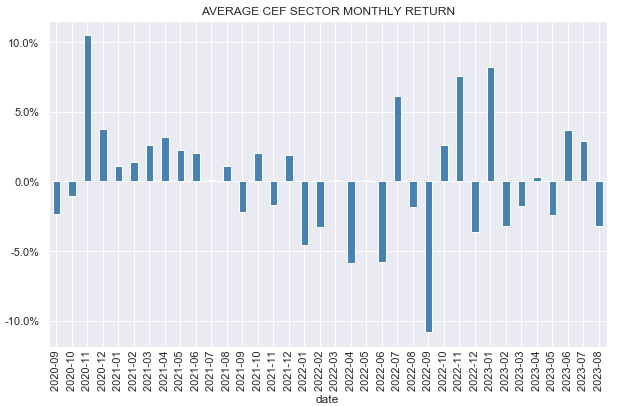
Fixed-income sector discounts have widened back out while equity sectors have rallied off their recent wides.
Systematic Income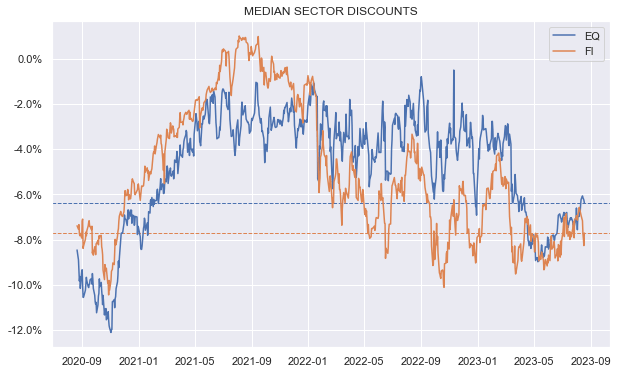
Muni and Loan sectors continue to trade at unusually wide discounts (discount percentiles around 20% or lower).
Systematic Income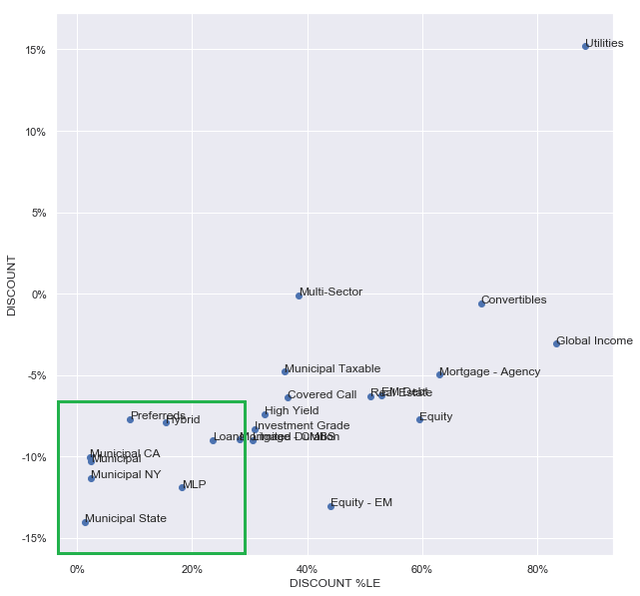
Preferreds have recently joined that group after a sharp widening in the Flaherty group of preferreds CEFs. These funds have struggled since 2020 given their lack of duration and leverage cost hedges.
Systematic Income CEF Tool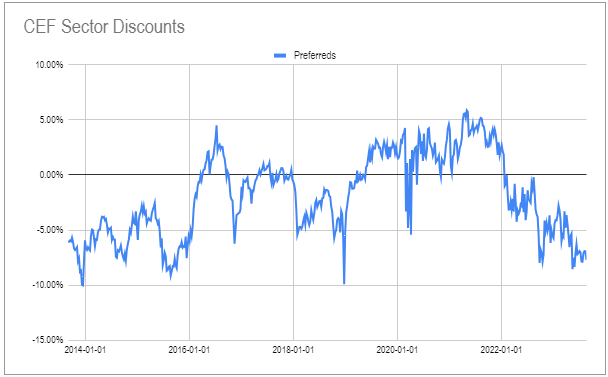
Market Themes
A reader recently commented on one of our CEF articles that the 5Y total return of various credit CEFs is miles off their high dividend yields. And this is why investors need to significantly dial down their return expectations when they allocate to CEFs.
Comparing total returns and yields is one element we use in our own analysis so in some sense this kind of comparison is fair game. However, when comparing total returns and yields investors need to be mindful of a couple of things.
First is that we need to be careful about the changes in yields over any given period. For example, high-yield corporate bond yields, which we use as a proxy for broader income market yields, rose from 6.3% to 8.5% over the last 5 years. For a fund with any level of duration that is going to be a significant headwind on its performance over the period.
FRED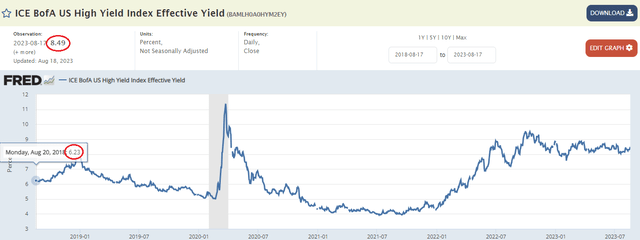
This drop in price will also push the yield higher, all else equal, creating a kind of artificial divergence between total return and yield. This is why we tend to focus on what we call flat-yield (or flat-spread for funds with floating-rate assets) return periods when evaluating a given fund’s prospective future return.
Second, many funds with some floating-rate exposure have been hiking distributions – another element of today’s unusually high interest rate environment. And because the yields of these funds have risen substantially only fairly recently it’s not reasonable to compare their current yield to a 5 year return period when their yields (and hence return potential) were significantly lower.
Third, credit funds have historically tended to overdistribute so a better point of comparison would be not their current yield but their underlying portfolio yield. The difference between the portfolio yield and total returns would be smaller in aggregate.
Fourth, credit funds have various slippages all of which will tend to push the return below the level of portfolio yield. These include credit losses, credit migrations that necessitate an exit, trading frictions and others, all of which combine to reduce a fund’s return relative to its yield.
All of these factors need to be taken into account when evaluating returns relative to yields. All in all, even with proper adjustments we expect credit CEF returns to run below their level of yield. However, this is simply the reality of the credit asset class and the CEF wrapper.
Investors who don’t like this profile should allocate to individual bonds (something we do as well) where the return behavior is of the what-you-see-is-what-you-get kind. Absent a default, investors will earn the yield on the bond (with a small deviation due to the rate at which the coupons are reinvested).
Market Commentary
Barings BDC-like CEFs MassMutual Participation Investors (MPV) and Barings Corporate Investors (MCI) raised their dividends by 14% and 9%. This all makes sense given what’s been happening in the BDC space.
Recall that these two funds are best thought of as quasi-BDCs rather than as CEFs. The reason they are quasi-BDCs is that they hold primarily private placement loans but are different from typical BDCs in a few key respects.
First, they are unusually lightly leveraged for a BDC with leverage of just 0.1x vs. an average of 1.1x. Two, they’re very obviously under-resourced for a real BDC. They charge 1.25% on net assets which works out to a bit over $4m. $4m might be fine for a couple of fund managers, legal support plus sundry expenses but it’s just too small to run a BDC.
Funds like MPV and MCI that piggyback on some sponsor deals don’t need a lot of support – just a couple of people to run the fund and maybe some research analysts. A BDC, on the other hand, needs a lot of loan structuring work plus it needs people who can work with the company to solve problems to get the company back on track.
This is why BDCs tend to charge a fee on 1) total assets, not net assets, 2) charge a higher management fee – 1.25% would be at the low end of the sector, 3) also charge income and capital gains incentive fees, 4) are just larger (causing fees to be larger too) – MCI and MPV would by one of the very smallest BDCs if they were one.
These are decent options for investors who like the concept of BDCs but are more comfortable with CEFs. The valuations on these are pretty reasonable at around double-digit discounts versus BDCs which are trading close to par on average. In this sense you get a quasi-BDC at a (cheaper) price of a CEF.
A number of Allspring funds updated their distributions – Allspring Global Dividend Opportunity Fund (EOD), Allspring Multi-Sector Income Fund (ERC) and Allspring Income Opportunities Fund (EAD) cut by less than 1% while ERC hiked by 0.2%. Recall that these funds have managed distribution policies that are a function of their 1 year monthly NAV average.
It is fairly straightforward to forecast distribution changes for these funds and whenever the NAV trends, distributions will tend to trend as well. EAD remains in our High Income Portfolio.
Overall the CEF market remains in a fairly unusual place of fairly tight credit spreads but wide discounts. This relatively mixed valuation picture keeps us focused on relative value opportunities and funds with fairly resilient distribution profiles.
Read the full article here


