Editor’s note: Seeking Alpha is proud to welcome Steven Bushong as a new contributor. It’s easy to become a Seeking Alpha contributor and earn money for your best investment ideas. Active contributors also get free access to SA Premium. Click here to find out more »
Thesis
Broadly speaking, there are two general approaches to try to assess the value of a company’s shares of equity: intrinsic valuation (i.e., calculating the value of a security’s price based on expected future cash flows from that security in a given timeframe) and a multiple valuation, where the share price of a security is compared against a key indicator of business operations. Sometimes, an intrinsic value calculation and a multiple valuation provide conflicting pieces of information about a company. However, when both an intrinsic valuation and a multiple valuation indicate that a company’s equity is undervalued, this can be a strong indicator of a buying opportunity.
Currently, this is the case for Realty Income Corporation (NYSE:O). Whether valued as only a function of all future dividends or comparing the current valuation to historical norms, Realty Income’s current share price offers an attractive entry point for an investment that ticks many boxes.
Company Overview
As a dividend aristocrat who is also a monthly dividend payer, Realty Income is one of the most popular choices for dividend growth investors. This is easy to understand, as few companies offer the combination of a high dividend yield (5.37% at the time of this writing), dividend safety, and regular dividend hikes. For investors using dividend reinvestment plans (DRIPs), Realty Income shares further accelerate compounding as O’s cash payouts are distributed monthly instead of quarterly.
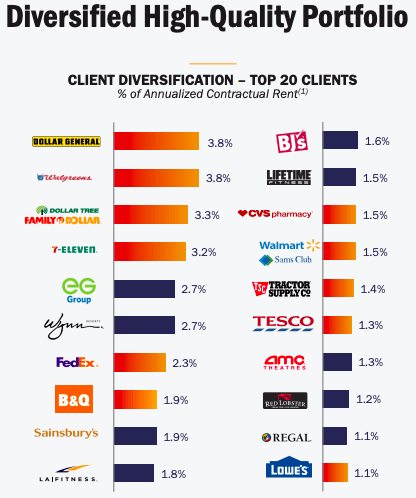
A key variable to consider when evaluating any REIT is the quality and concentration of the tenant base. Some investors may be turned off by the idea of purchasing a retail-focused REIT based on recent trends in the retail industry. However, O’s tenant base reflects the kinds of businesses who will very likely be able to maintain their fixed coverage ratios (i.e., rents) even if the most predicted recession in US history does finally end up materializing.
Realty Income Investor Presentation, Q2 2023
Source: Realty Income Investor Presentation, Q2 2023
A quick look at Realty Income’s list of tenants reveals the kinds of tenants who sell normal goods (i.e., pharmacies, groceries), where demand is mostly unresponsive to changes in incomes or even inferior goods, where demand counterintuitively increases as incomes decrease (i.e., Dollar General). With no single tenant taking up more than 3.8% of the total tenant base, O has spread their eggs across many baskets. This kind of tenant structure and concentration makes the recent comments by CEO Sumit Roy about O being recession-proof seem rooted in evidence, and more than just the kind of reassuring talk that CEOs say about their business models before recessions begin.
A strong dividend history and a safe margin for the dividend are great lagging indicators. However, a consideration of key business operations is necessary to make forward-looking judgments. Fortunately, multiple recent transactions should be interpreted as bullish signals from the management team.
Prior to the end of Q2 2023, Realty Income has recently raised some additional financing through the issuance of both equity and debt. Approximately $2.2 billion was raised from the issuance of up to 120 million shares of common equity. Additionally, the Q2 press release indicates that another $1 billion was raised from the issuance of unsecured notes not due until December of 2028 at the earliest.
The Q2 2023 earnings call transcript makes the reason for this raising of cash clear: Realty Income plans on hastening the pace of their property purchases. As CEO Sumit Roy mentioned on the call, “we are increasing our outlook for investments to over $7 billion for 2023.” Increased investments in new properties will only continue to boost rents and funds from operations (FFO), resulting in an even safer dividend.
The guidance for 2023 was also narrowed to $3.96 – $4.01. Even if the lowest end of the guidance is assumed, the annual dividend is still well covered at 129% ($3.96/$3.07) from AFFO.
Multiple Valuation
The dominant multiple valuation for REITs is share price/funds from operations (P/FFO), which serves as an equivalent to the P/E ratio for common equity of typical corporations. At the time of this writing, O’s P/FFO (FWD) multiple sits at 13.65.
A more conservative metric would be P/AFFO (adjusted funds from operations), which controls for “unique revenue and expense items.” For Q2 of 2023, Realty Income’s FFO was $1.02 per share, while AFFO per share was $1.00. Therefore, the P/AFFO (FWD) at the time of this writing is 14.09.
Compared to historical averages, Realty Income’s current multiple valuation of P/FFO (13.65x) and/or P/AFFO (14.09x) are significantly below the range of 20x – 25x where O’s shares have historically traded.
Intrinsic Valuation
When attempting an intrinsic valuation, a critical step for any analyst is to determine the valuation model of best fit for a business. As the Gordon Growth Model (GGM) is best for businesses who are in the mature stage of their growth cycle and are relatively insensitive to fluctuations in demand from the business cycle, the GGM is tailor-made for the above business profile and dividend history of Realty Income. The GGM assumes that a corporate issuer will continue to grow their dividends in perpetuity. This is a safe assumption, considering O’s historical business execution and track record of distributions.
The current annual dividend of Realty Income will be estimated at $3.06 ($.255 x 12 months), which builds some conservatism into this model as it excludes the two dividend increases that will likely occur before the end of 2023. The annual dividend growth rate of Realty Income is also fairly straightforward, as regular quarterly dividend increases of $.005 are also clearly observable in the company’s dividend history.
O’s 5Y dividend growth rate is slightly over 3%, which is a decent proxy for a forward-looking dividend growth rate. To again slightly err on the side of conservatism, 3% will be used for the dividend growth rate.
The input into this version of the GGM that requires the most subjectivity and interpretation is the required rate of return. The increase in the federal funds rate by the Federal Reserve since Q1 of 2022 has resulted in a 10-Year US Treasury yield of 4.21%. With the risk-free rate of return settled, the remainder of the required rate of return will be determined by the Capital Asset Pricing Model (CAPM). With a beta of .79 and assuming a 9% market rate of return (O is in the S&P 500), the required rate of return works out to: .0421 + .79*(.09-.0421), or .079941, rounded up to 8% for an easy calculation.
Therefore, the math works out to: $3.06(1.03) / (.08 – .03) = $63.04
Due to its simplicity, The Gordon Growth Model is very sensitive to the input values of a required rate of return and the dividend growth rate. Accordingly, these inputs have been estimated towards the more conservative end of the valuation.
GGM Intrinsic value calculation: $63.04.
Share price at the time of this writing: $56.32.
Risks
The current occupancy rate for Realty Income stands at an all-time high of 99.0%, which is another way to say it can really only go down. If interest rates continue to rise and overall economic activity decelerates as a result, it’s easy to envision an economic environment where the occupancy rate decreases. This would likely be reflected in the share price.
Furthermore, REIT share prices are more interest rate sensitive than most other shares of equity. With The Fed’s current restrictive approach of “higher for longer”, and with more rate hikes potentially on the way as inflation proves more stubborn than initially thought, share prices for all REITs may continue to decline. Just because Realty Income’s shares are currently trading at very low multiples compared to historical norms, the recent sell-off could continue. Investors with a shorter time horizon may be underwhelmed at how O’s share price recovers.
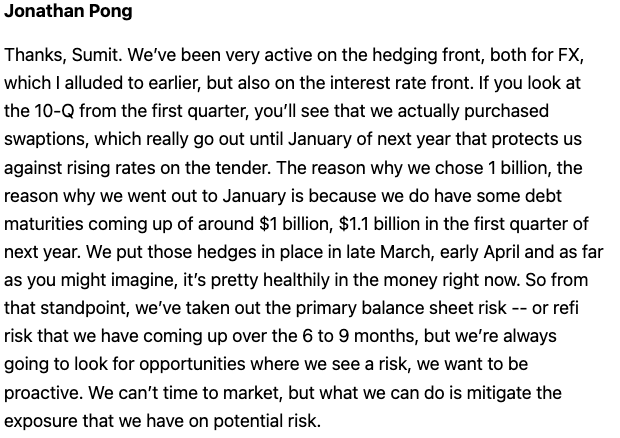
No discussion of investing in REITs would be complete without a discussion of debt. The most significant item to mention here is the debt maturing in Q1 and July of 2024 (see: page 9 of the Q2 Supplemental). In response to an analyst’s question about rising rates in the recent Q2 earnings call, Jonathan Pong, Senior Vice President and Head of Corporate Finance offered this window into the capital allocation strategy:
Seeking Alpha: Q2 2023 Earnings Call Transcript
It’s clear that there has been a plan in place to meet the upcoming debt maturity obligations with sufficient liquidity so as to not disrupt future dividend payments.
Conclusion
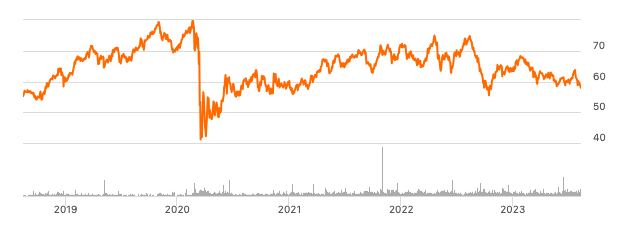
With an intrinsic value calculation approximately 10% below the current share price, there is strong reason to believe that O’s shares are currently trading at a small discount. Additionally, the comparison of current P/AFFO to a historical average range of P/AFFO suggests an even larger discount. The current multiples for O suggest that investors buying in now will also experience some share price appreciation over a multiple-year holding period as an additional source of return that was not factored into the intrinsic valuation. A look at the 5Y share price performance of Realty Income shows a business whose shares do not go on sale often:
Seeking Alpha: Realty Income 5Y Share Price
Source: Realty Income Corporation (O).
Businesses with this combination of dividend yield, dividend safety, and historical track record of performance usually trade at a market premium, rather than a discount to intrinsic and market value. With multiple layers of conservatism baked into the model and historical evidence of anticipated share price appreciation not baked into the model, Realty Income appears to be an excellent choice for retail investors and/or fund managers with a long time horizon whose investment objective is consistent and reliable dividend income with some dividend growth.
Read the full article here


