Tesla (TSLA) has been one of the weaker performers on the S&P 500 over the past month. But it is important to note that shares nearly doubled from their Q2 low to the late July peak, so some give-back is perhaps to be expected. After the stock neared my price target a month ago, and with shares dropping back near noted support, I assert that TSLA looks good for a rebound.
Today, I am revisiting the strategy around the Direxion Daily TSLA Bull 1.5X Shares ETF (NASDAQ:TSLL). Amid poor seasonal trends through mid-November, but decent price action after a correction, I have a buy rating but risk management is critical with this leveraged ETF.
1-Month S&P 500 Performance Heat Map: TSLA Weakest Mega-Cap
Finviz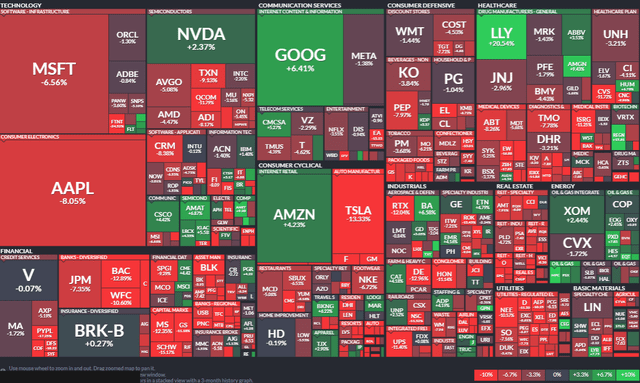
Of course, when dealing with leveraged ETFs, it is crucial to acknowledge the risks associated with holding onto these products for extended periods. One significant danger is the potential for negative compounding returns, which I will provide an example of shortly. While these ETFs can yield substantial gains within short timeframes, it is important to remember that they should be approached as tactical, short-term investment options rather than viable long-term holdings, hence this article is very short-term oriented, not a deep dive into Tesla as a company. For a deeper understanding of the risks tied to leveraged ETFs, you can refer to authoritative bodies such as the SEC. More information can be found in the updated Investor Bulletin titled: Updated Investor Bulletin: Leveraged and Inverse ETFs
According to the issuer, TSLL seeks daily investment results, before fees and expenses, that are 150% of the performance of the common shares of Tesla. Direxion highlights a major risk with TSLL:
Unlike traditional ETFs, or even other leveraged and/or inverse ETFs, these leveraged and/or inverse single-stock ETFs track the price of a single stock rather than an index, eliminating the benefits of diversification. Leveraged and inverse ETFs pursue daily leveraged investment objectives, which means they are riskier than alternatives which do not use leverage.
Here is an illustration of how negative compounding returns occur in a leveraged ETF: Suppose an index starts at 100, and the leveraged product also begins at 100. If the index rises by 10% to 110, the 1.5x long product increases to 115. However, if a subsequent 10% drop happens, the index falls to 99 (a 1% loss from the initial value). In contrast, the 1.5x long fund declines to $97.75 (0.85*115), reflecting a 2.25% decrease.
TSLL has gathered significant assets since I last reviewed the fund. Total assets under management are up to $940 million and liquidity is strong with the ETF’s 3-month average daily volume being near 14 million shares. It’s an expensive product, though, and with an annual expense ratio of 1.08%, that is another reason to avoid holding TSLL for prolonged periods. As far as what makes up the ETF, it is a mix of TSLA shares, swaps, and cash.
TSLL: Top Holdings & Trading Data
Seeking Alpha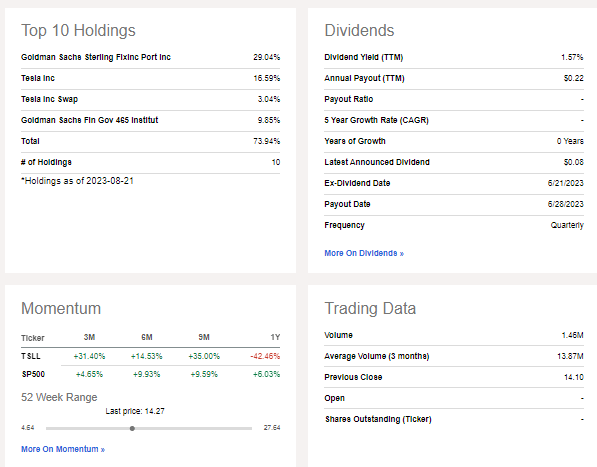
As for a quick look at TSLA’s fundamentals and valuation, the Automobile Manufacturers industry company within the Consumer Discretionary sector trades at a high 68 forward operating earnings multiple with a strong 40% annual revenue growth rate. Its margins remain solid at more than 20% for its gross margin, but concerns regarding price cuts for some of its EVs is a risk.
Still, with a forward non-GAAP PEG ratio of 2.8, it is not overly expensive when considering the growth trajectory. Of course, we are focusing on a short-term trading vehicle in this analysis, not a long-term investment in Tesla stock.
TSLA: Richly Valued, But Not When Accounting For Big EPS Growth
Seeking Alpha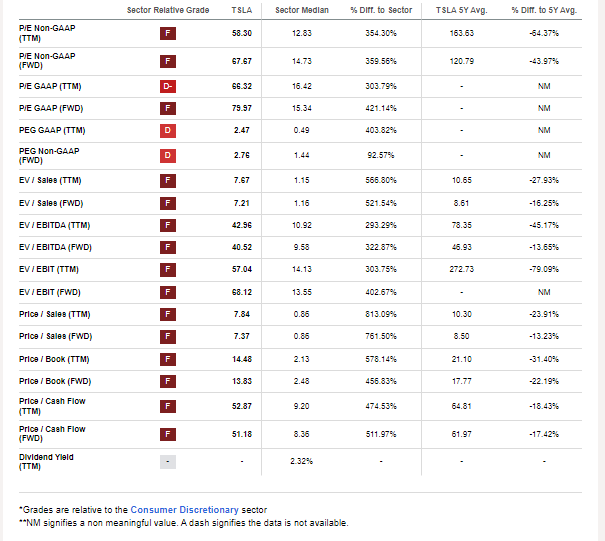
Looking ahead, corporate event data provided by Wall Street Horizon shows a light calendar. The only events that could draw volatility are its October 2 interim production data for Q3 along with the full third-quarter earnings report unconfirmed for Wednesday, October 18.
TSLA: Corporate Event Risk Calendar
Wall Street Horizon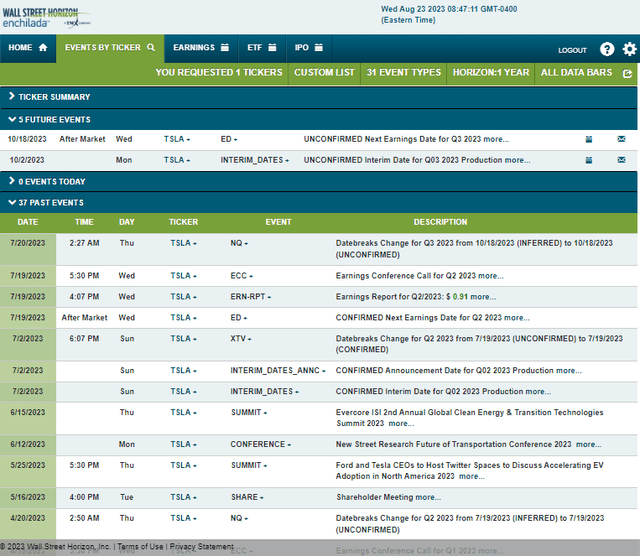
Seasonally, Tesla shares tend to encounter a struggle from late August through mid-November, according to data provided by Equity Clock. So, being choosy about when to enter a long position in TSLL over the next few months is warranted, and given the fund’s leverage construction, volatility could lead to particular downside risk should it indeed materialize over the coming weeks.
TSLA: Volatile Seasonal Trends Through Mid-November
Equity Clock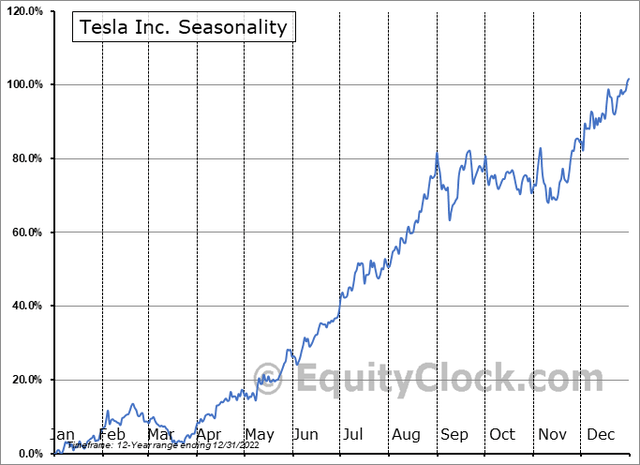
The Technical Take
In order to find what levels may be best to buy and sell TSLL, we must analyze the underlying stock chart of Tesla. Notice in the graph below that shares pulled back to a key support range this month. The $197 to $208 range has been key in the past, and the latest test appears constructive for higher prices in the weeks ahead. Of course, with TSLA now more than 15% above that range, and with resistance apparent in the $299 to $315 area, a trading range appears more likely than an established uptrend. But take a look at the long-term 200-day moving average – that line has flattened out, indicating a trend change that had been one owned by the bears to more of a neutral look today.
Moreover, volume trends paint an interesting picture in that there was a rise in volume on TSLA’s June ascent while the number of shares traded fell off as the stock dropped in August. That tells me there is more conviction on the buy side with TSLA right now. So, the latest shakeout that took TSLA from $299 to $212 occurred with a dip under 30 on the RSI momentum indicator at the top of the chart – a necessary corrective event following the stock price double from May through late July. Finally, TSLA stock dipped right into a high area of volume by price as you can see on the left side of the graph.
Overall, it is not a screaming buy momentum stock, but I would lean bullish on TSLA with a stop under $190. So, buying TSLL with a target that corresponds to the upper $200s on TSLA and a sell stop that corresponds to just under $190 on the stock is a risk-conscious way to play it.
TSLA: An Emerging Trading Range
Stockcharts.com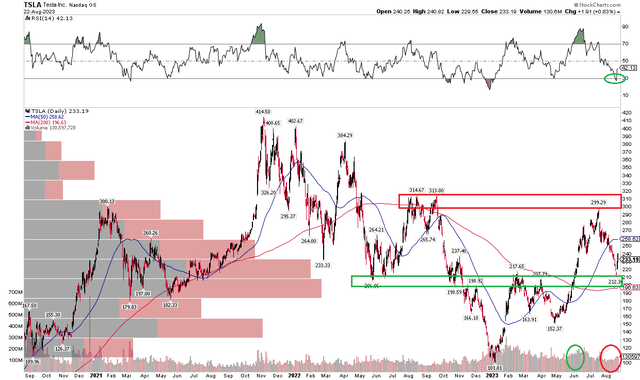
The Bottom Line
I have a buy rating on TSLL and the noted price levels may be considered when trading this leveraged fund. A key risk is bearish seasonality.
Additional disclosures:
1) The Lowdown on Leveraged and Inverse Exchange-Traded Products (FINRA)
2) Leveraged and Inverse ETFs: Specialized Products with Extra Risks for Buy-and-Hold Investors (SEC)
3) FINRA’s Reminder on sales practices for Leveraged and Inverse ETFs (FINRA)
Read the full article here


