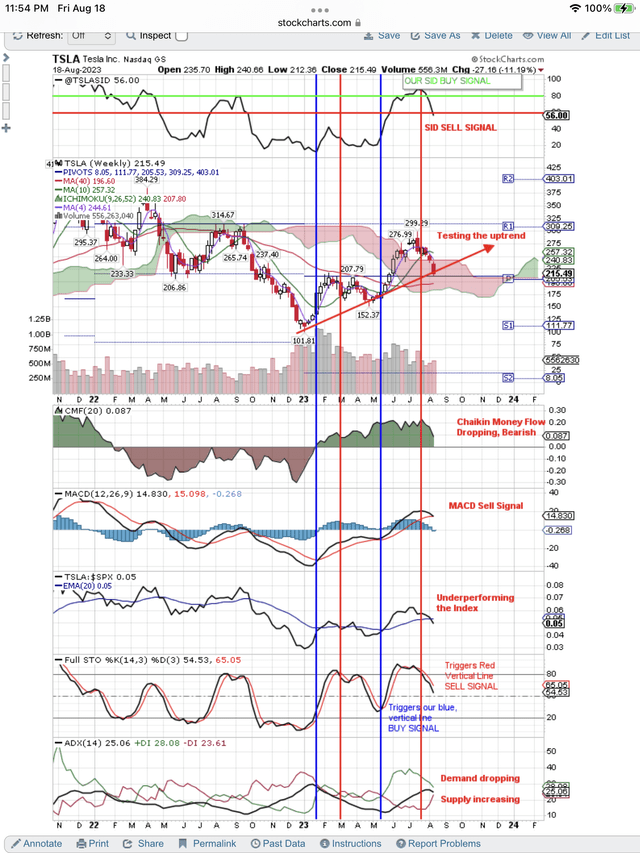
Right after our last article, Tesla (NASDAQ:TSLA) popped on some surprising good news and reversed our Sell Signal. You can see this reversal of our SID Sell signal at the top of the chart below, as published daily to our subscribers. Our Sell Signal, below the red line, went from a Sell to a Hold signal and clicked off a Buy Signal at the green line. Now the MEME move is over, and it is reversing back to a Sell signal for a round trip. Investors have a longer term view and for that we have to look at our weekly chart with its long term uptrend in price. Is it about to breakdown or will the uptrend survive? Will TSLA retest the bottom?
NVDA Round Trip, Sell To Buy To Sell Signals (StockCharts.com)
Portfolio managers make their decisions based on fundamentals. When they want to buy or sell, they check with the technicians on their trading desk to optimize the timing of their Buy or Sell. Naturally, they want to buy on weakness and sell into strength. That is their discipline. Small investors don’t have a trading desk with technicians, so they need to consult a chart when they buy or sell, if they want to optimize.
We like to check in with Seeking Alpha’s Quantitative Ratings to find out the fundamentals that portfolio managers are using to make their decisions. They use fundamental analysts to help them do their due diligence. We use SA articles and fundamental Quant Ratings to do the same.
SA has good ratings for Growth, Profitability and Momentum, but weak grades for Valuation and Revisions. It is not unusual for growth stocks to be overvalued, as long as revisions are good. Growth stocks get hit hard when weak revisions indicate slow growth. SA ratings explain why price is dropping.
We, of course, are disappointed that our previous SID grade went from a Sell to a Buy Signal. However, being technicians enables us to trade the signals. We can take advantage of the market making a mistake, by using technical signals.
You can see what these technical signals were telling us on this round trip price action in TSLA. At the top of the chart is our SID score, and because it is a lagging indicator, changes in direction are very important. Changes in direction in SID are a leading indicator of changes in the SID signal.
On the above chart, you can see where our SID signal changed direction and started falling from a Buy Signal to a Sell Signal. We use technical indicators which lead our SID signal. You can see the red, vertical line, technical Sell Signal that we have drawn on the chart. It was triggered by the Full STO signal at the bottom of the chart. We use these two signals to sell.
Because of these Sell Signals, we expect price to break below the red arrow uptrend on the price part of the chart. This is what we expected last time. Could it change with some other unexpected good news? Of course, and our signals will reverse as they did last time. We reverse with the signals.
As of today we have Sell Signals, and we are going with those signals until TSLA proves itself. Naturally, this move down in the overall market is taking TSLA down. Index selling takes the good stocks down with the bad. Bottom fishing bargain hunters buy the good stocks when they are down and let the overvalued stocks fall until they are fairly valued.
We will wait to see where the portfolio managers think TSLA is a bargain and where they come in to start buying. Last time that was at $152, so we will wait for that price or a blue, vertical line, Buy Signal whenever that happens.
Naturally we look for confirming Buy Signals in the CMF, MACD and ADX shown at the bottom of the chart. We look for a change in direction in the CMF. We look for a crossover on the MACD. Lastly, we look for a change in direction in Demand and Supply on the ADX shown at the very bottom of the chart.
This time we will post the change in signals to this article. Sorry that we did not do it last time. You can always message me if you think the signals are reversing, and I will confirm and post.
Read the full article here


