The S&P 500 (SPY) accelerated lower this week, breaking potential supports along the way and undoing all of July’s gains. Admittedly, my 4448-4458 target for this pullback was off the mark. However, as I’ve mentioned before, levels on a chart are only one part of technical analysis; evaluating and reacting to price action is just as important. Once 4444 broke, this week’s action was persistently bearish and gave no reason to buy: Tuesday broke the 50dma and closed weak, Wednesday broke the channel and closed weak, Thursday broke the July lows and closed weak. Only Friday showed any positive action, but was far from a conclusive reversal and the pattern was very similar to the previous Friday. We all know what happened after that.
Due to the bearish action, there are some important issues to be addressed in this update. Can we still expect new highs? Will 4325 support break? Could the S&P500 crash?
To answer these questions, a variety of tried and tested technical analysis techniques will be applied to the S&P 500 in multiple timeframes. The aim is to provide an actionable guide with directional bias, important levels, and expectations for price action. The evidence will then be compiled and used to make a call for the week(s) ahead.
S&P 500 Monthly
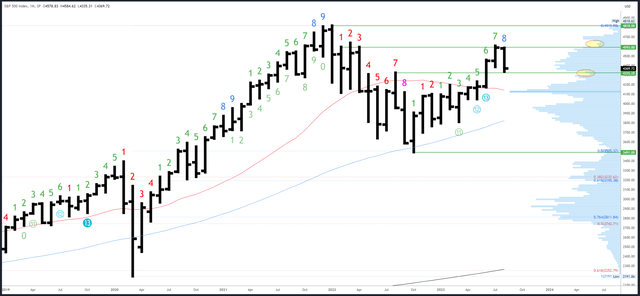
Breaking the July low of 4385 is a bearish development, and cancels out the bullish bias created by the strong July close and lack of a reversal pattern at the top.
For now, the monthly chart is neutral. Positive action such as a close above 4385 and bullish weekly/daily patterns could shift it back, or on the other hand, a break and close below 4325 would shift it bearish.
Worth noting is the volume profile on the right of the chart. Volume decreases significantly below 4325 and above 4600; trading (volume) tends to happen inside the range.
SPX Monthly (Tradingview)
Monthly resistance is 4593-4607. 4637 is the next level above, then the all-time high of 4818.
4325 is significant support followed by 4195-4200.
The monthly Demark exhaustion signal is on bar 8 of a possible 9 in August. We can expect a reaction on either bar 8 or 9, usually only when higher highs are made, but this time it looks like the exhaustion has started already.
S&P 500 Weekly
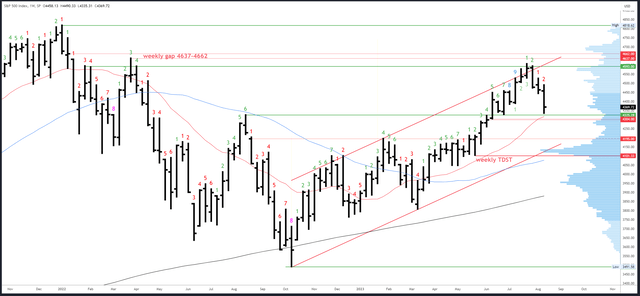
Last week pointed out the weekly bar was bearish and “this isn’t usually how a reversal sets up.” The exact same thing can be said this week and Friday’s small bounce was not enough to reverse the bearish bias.
Lower lows look likely before any sustained recovery attempt which means there should be a test of the obvious support at the 4325 pivot and the rising 20-week MA. While this should hold on a closing basis, there is the potential for a spike through this area to flush out weak hands. A small weekly gap from 4298-4304 is a possible target. Should there be a strong reversal back over 4325 from gap fill, it could mark a significant low.
SPX Weekly (Tradingview)
4444 is the first resistance, then 4490.
As mentioned earlier, the 4325 is significant support, with a small gap at 4298-4304 should this area be flushed. 4195-4200 is the next reference.
An upside (Demark) exhaustion count has completed and is having an effect. A new downside count will be on bar 3 (of 9) next week.
S&P 500 Daily
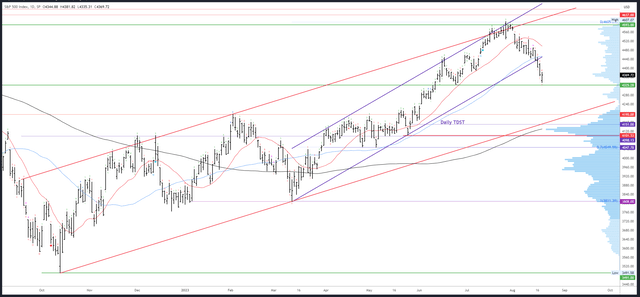
The break of the 50dma and channel is important as it tells us the trend sequence starting at the March low is over. We are therefore dealing with a larger correction which is likely proportional to the February-March correction, or possibly the December 2022 correction. If it is the former, it would take price all the way to the red channel currently near 4150. If it is the latter, time/price equality would target around 4300, which is also the weekly gap area mentioned earlier.
There is of course another alternative: the decline could be the beginning of another bear market targeting new lows under 3491. I am certainly open to this idea and have no bias either way. However, I would need to see further evidence of bearishness, starting with a weekly close below 4325.
SPX Daily (Tradingview)
The 50dma and channel will be resistance in the 4460 area. Should Monday’s session continue Friday’s bounce like it did this week, I’d be sceptical unless it breaks and closes above 4421 to show strength.
Potential supports are the same as on the weekly chart.
Downside Demark exhaustion failed to have an effect. A new count is underway and will be on bar 5 on Monday, which means a reaction could be seen on Thursday/Friday on bars 8 and 9.
Events Next Week
Data is quiet again next week, which is probably bad news as long-term yields look like continuing higher until weak data or another catalyst ignites a reversal.
PMIs are due out on Wednesday, and the highlight of the week is the central bank gathering at Jackson Hole. Fed Chair Powell will speak on Friday.
Probable Moves Next Week(s)
It is unlikely this week’s 4335 low was the bottom of this decline and unless key levels such as 4421 can be reclaimed, lower lows are probable before any reversal develops.
A lower low would target the major level of 4325. At some point there could be capitulation below this point, in which case 4298-4304 could support. A recovery from this gap back above 4325 and into a strong weekly close would be a bullish signal.
Failure to recover from the 4300 area and more sessions closing at the lows would keep the bearish pressure on. A weekly close under 4325 would open up 4200 as a target.
Read the full article here


