The dividend factor has had a tumultuous last several quarters. It performed well during 2022’s stock market drop, even as interest rates were on the rise. The calendar flipped to 2023, and so too did the script regarding value and growth stocks’ relative performances. High-dividend equities underperformed from January through this past May. Lately, however, big yielders have caught a bid as volatility has returned to the broader market. While short-term yields are upwards of 5.5%, I notice some bullish trends in one niche of the Energy market that sports a lofty distribution rate.
I am upgrading my previous hold rating on the Global X MLP ETF (NYSEARCA:MLPA) to a buy based on the portfolio’s low valuation, high yield, better price action compared to the broader market, and an expectation that the value trade may be preferred into year-end.
1-Year Factor Returns: Dividend Stocks Soft

Koyfin Charts
According to the issuer, MLPA seeks to provide investment results that correspond generally to the price and yield performance, before fees and expenses, of the Solactive MLP Infrastructure Index. MLPs typically pay high yields to investors because they do not pay corporate income taxes. The fund itself invests in midstream pipelines and storage facilities that have less sensitivity to energy prices compared to integrated oil companies and E&P names. It invests in growth and value stocks of companies across diversified market capitalization.
MLPA is a moderate-sized ETF with total assets under management of $1.35 billion and it pays a trailing 12-month dividend yield of 7.5% as of August 18, 2023. Liquidity is not always ideal with MLPA as its typical trading volume is just barely more than 100,000 shares and the fund’s 30-day median bid/ask spread is 0.16%, so using limit orders during periods of weak liquidity is warranted. In terms of its expenses, the total expense ratio is moderate at 0.45% on the portfolio of 19 stocks.
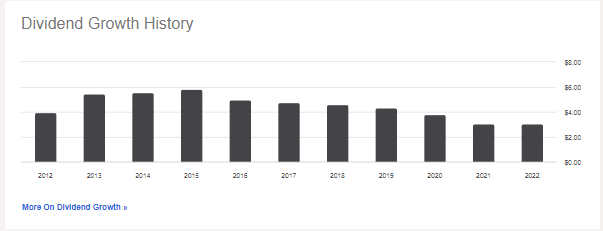
MLPs were a hot trade several years ago when dividends were on the rise, but I noticed that MLPA’s dividend growth history is quite weak. Notice in the graph below that the total payout amount fell in the past 7 years, but 2023 is pacing for its first positive turn in dividends since 2015, which is a sign that cash flow is better for MLP companies – a trend seen across the Energy sector.
MPLA Annual Dividend Growth, Expecting a 2023 Rise
Seeking Alpha
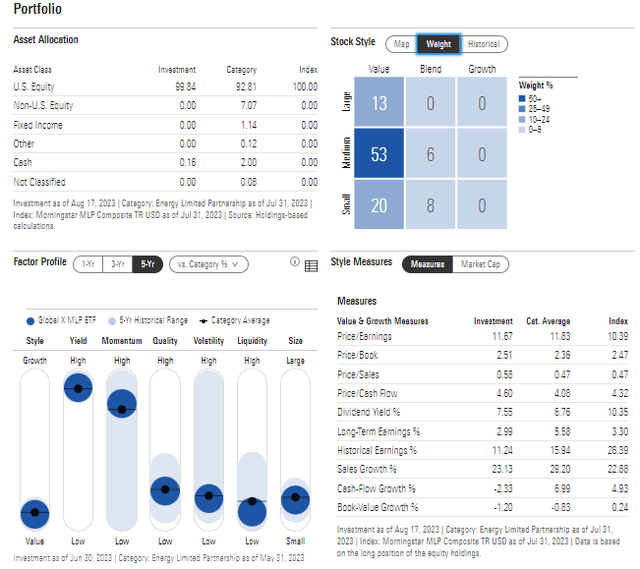
Digging into the portfolio, MLPA is very much on the value side of the Morningstar Style Box. Just 14% of the fund is considered “blend” and there is no growth exposure. Prospective investors should also be aware of the ETF’s high allocation to domestic small and mid-sized companies. Nearly 60% is mid-cap while 28% of the fund is small-cap – that means there’s added cyclical risk to this rather aggressive mix of energy storage and transportation names (and energy processing firms). On valuation, the ETF has a weighted average price-to-earnings ratio of less than 12, per Morningstar while its price-to-book ratio is likewise low at 2.5. Shares sport solid momentum, too.
MPLA: Portfolio & Factor Profiles
Morningstar.com
MLPA is a focused strategy with 91% of assets in the top holdings and the entire portfolio consisting of just three industries. Keeping up to date with events in the top holdings is important for active investors.
MLPA: Top 10 Holdings & Industry Breakdown

Global X ETFs
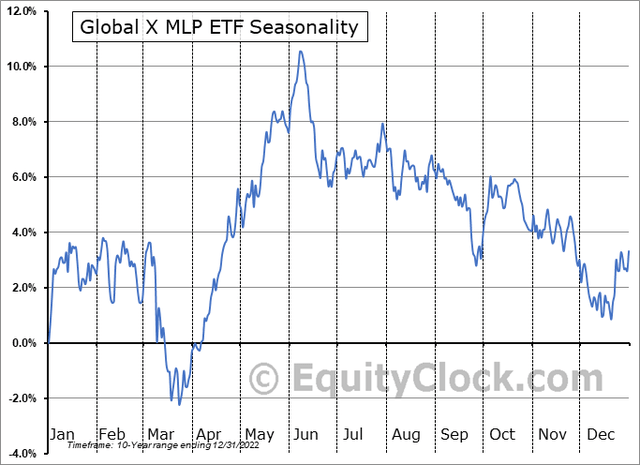
Seasonally, we are smack dab in the middle of a bearish calendar stretch for MLPA, according to data from Equity Clock. A more bullish opportunity could come about toward the end of Q3 or even in the final weeks of the year. Still, MLPA has produced modest total returns in its 10-year history through the end of 2022.
MPLA: Bearish Seasonal Trends Through Mid-December
Equity Clock
The Technical Take
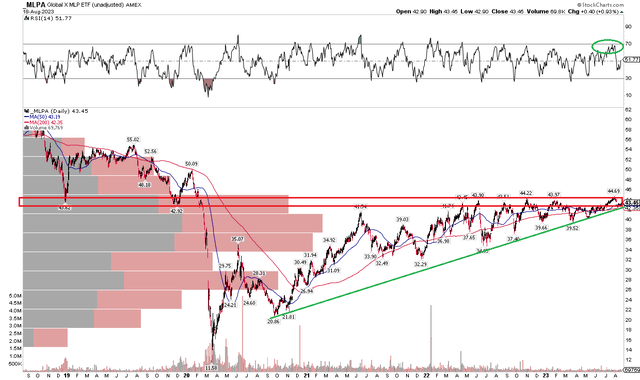
Back in 2022, I initiated coverage on this ETF with a hold rating, then I reiterated that stance several months later. Today, not a whole lot has changed from a technical perspective, but there are some green shoots to be aware of. Notice in the chart below that MLPA remains in consolidation mode at key resistance. The $43 to $45 area has met sellers rather consistently over the past several quarters.
Now, though, with a rising long-term 200-day moving average along with a recent rebound peak in the RSI momentum index at the top of the graph, there are signs that the bulls are taking the reins. Still, I’d like to see a more definitive breakout on high volume. But with a series of higher lows dating all the way back to March 2020, an uptrend exists. Overall, it’s perhaps a bit premature to get super bullish on MLPA right now, but there are encouraging signals.
MLPA: Encroaching on Resistance, Improved RSI Momentum
Stockcharts.com
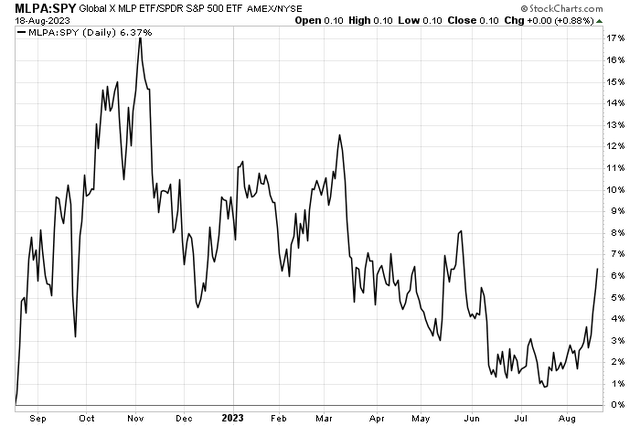
And just recently, relative strength in MLPA compared to the S&P 500 ETF (SPY) has taken a leg higher. With the value versus growth trade now appearing to shift toward the former, we could see more upside in sectors like Energy.
Bonus Chart: MLPA Relative Momentum Rising
Stockcharts.com
The Bottom Line
I am upgrading MLPA from a hold to a buy. The fund features a high yield and should end up paying out more this year than was seen in 2022. With a low valuation and a positive turn in momentum, I would be overweight MLPA going into the end of the year.
Read the full article here


