Helix Energy Solutions (NYSE:HLX) reported strong financial performance for Q2-2023 and updated its guidance for the remainder of the year. The company beat revenue expectation by $34.99 million and reported 89.9% revenue growth YoY. The company updated its financial outlook for the remainder of 2023 and gave some updates for 2024. The company expects improved performance because more vessels are out of maintenance and committed through contract. The company attributed strong demand for its services as an ongoing synergy. I covered the company prior to earnings and rated it as a hold. I now rate the company as a buy. If the stock price reaches $11 in the near future, then gains of 18% may be realized.
Operations
Helix Energy Solutions operates a fleet of specialty vessels and equipment for servicing offshore energy operations. The company specializes in well enhancement and decommissioning. The company’s technical equipment includes robotics for underwater trenching, seabed clearance, and offshore construction. The company also works in shallow water abandonment, including offshore oilfield decommissioning and reclamation. The company operates in Europe (North Sea), West Africa, Asia (Thailand and Australia), South America (Brazil), the Gulf of Mexico, and the US East Coast. The major operating segments for the company are Well Intervention, Robotics, Production Facilities, and Shallow Water Abandonment. The company has sections on its website which cover its assets and specialty services.
Q2-2023 Results and Outlook
Results for Q2-2023 were improved compared to the previous quarter and YoY. Helix Energy Solutions reported revenues of $309 million, representing a 23.5% increase from last quarter and an 89.9% increase YoY. The company reported a net income of $7 million compared to a net loss of $1 million in the previous quarter. Adjusted EBITDA for Q2 was $71 million, an increase of more than a 100% from the last quarter and YoY. Gross profit was $55 million, representing a 263% increase from the previous quarter. The company reported operating cash flow of $32 million and free cash flow of $30 million.
Helix Energy Solutions attributed strong results to better weather in the North Sea and Gulf of Mexico. Demand for its services is growing in the offshore renewables market in the US and Asia Pacific. The company reported high utilization of its vessels and equipment during the quarter. The company expects financial performance to improve over the next two quarters.
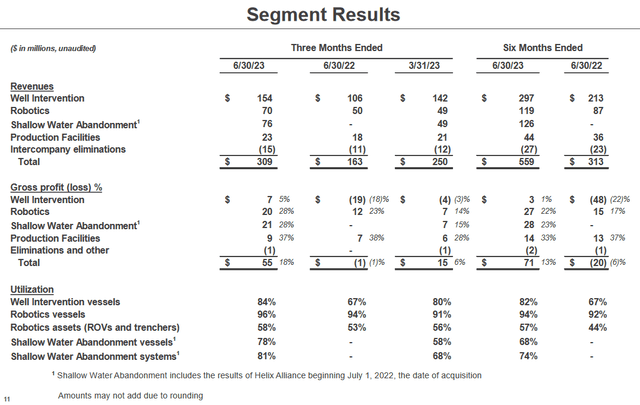
The company reported segment results as follows:
Earning Call Presentation
Source: Q2-2023 Earnings Call Presentation
Across the segments, there is an increase in revenue from the previous quarter and YoY. The company reports a higher percentage of utilization for the quarter compared to the previous quarter and YoY. Gross profit has also increased for each segment.
The company announces Q3-2023 earnings in October. The market consensus for the quarter is $340.29 million, which represents a 10% increase from the previous quarter. The company stated in its Q2-2023 earnings transcript that it expects strong financial performance for the rest of the year.
Here is a data chart of the company’s last five quarterly earnings:
|
Amounts in $US Millions |
Q2-2023 |
Q1-2023 |
Q4-2022 |
Q3-2022 |
Q2-2022 |
|
Revenues |
308.8 |
250.1 |
287.8 |
272.5 |
162.6 |
|
Cost of Revenues |
253.5 |
234.9 |
256.5 |
233.3 |
164.0 |
|
Gross Profit |
55.3 |
15.2 |
31.4 |
39.2 |
(1.4) |
|
Operating Expenses |
24.0 |
19.6 |
22.8 |
23.6 |
16.0 |
|
Operating Income |
31.3 |
(4.4) |
8.6 |
15.7 |
(17.4) |
|
Net Income |
7.1 |
(5.2) |
2.7 |
(18.8) |
(29.7) |
|
Cash & ST Investments |
182.7 |
166.7 |
186.6 |
162.3 |
260.6 |
|
Total Receivables |
262.4 |
218.8 |
219.1 |
258.8 |
192.5 |
|
Total Current Assets |
512.0 |
449.4 |
460.6 |
476.1 |
485.4 |
|
Total Assets |
2,423.8 |
2,369.3 |
2,389.3 |
2,355.5 |
2,213.7 |
|
Accounts Payable |
145.9 |
134.4 |
135.3 |
131.9 |
99.7 |
|
Total Current Liabilities |
382.7 |
288.0 |
298.0 |
330.5 |
232.7 |
|
Total Liabilities |
891.9 |
853.6 |
872.6 |
873.6 |
681.9 |
|
Levered Free Cash Flow |
105.7 |
4.9 |
16.2 |
14.5 |
83.0 |
|
Total Debt |
447.8 |
460.1 |
469.7 |
478.6 |
410.4 |
|
Net Debt |
265.2 |
293.4 |
283.1 |
316.3 |
149.8 |
|
Book Value Per Share |
$10.16 |
$10.01 |
$9.98 |
$9.76 |
$10.10 |
Source: Seeking Alpha
The company’s revenue, gross profit, and net income have improved. The company is showing lowered debt and higher free cash flow.
The company addresses future performance in its Q2-2023 earnings transcript. Because the maintenance period is over for some of its vessels, the company expects stronger results for the rest of 2023 and first part of 2024. The company’s services are in high demand, and it has a large number of vessels under contract through 2024. In addition, its fully owned subsidiary, Helix Alliance, was recently awarded a contract for decommissioning 39 wells in the Gulf of Mexico.
The company has increased its 2023 outlook. It now expects FY2023 revenues to be between $1.175 and $1.25 billion. The company had reported a lower outlook during Q1-2023 reports within the range of $1 billion and $1.2 billion. The company has increased its upward forecast. The company expects to report free cash flow for PY2023 between $110 million and $150 million. Capital expenditures will be limited to $50 million and $70 million, which is lower than previously expected.
Stock Price Uptrend
StockCharts
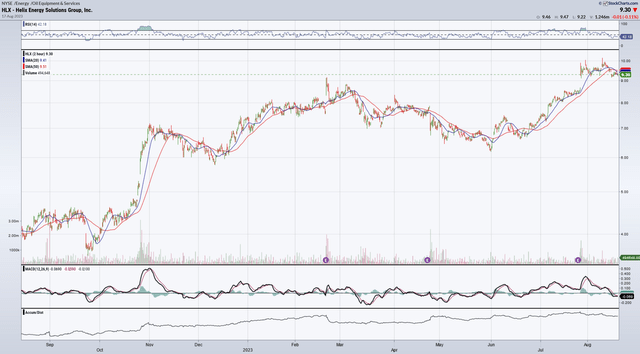
1-Year Price Performance Chart from StockCharts.com
Helix Energy Solutions’ stock price has gained 136% over the last year. It is up 26% YTD, 39% over three months, and 12% over one month. It is currently trading above its 20/50/200 moving day averages. The stock price has stabilized above $9 per share since the end of July has tempted the $10 per share mark.
The $9-$10 price channel represents a twelve-month high for the stock price. Resistance at $10 may or may not give out over time even with improved performance results. The one-year uptrend of the company’s stock is not guaranteed to continue, but future quarterly reports should move the price higher. The company’s stock has high institutional ownership at 94%. The high percentage and the long-term uptrend may reflect positive investor sentiment.
Valuation and Risk
The current book value per share for the company is $10.16. The company is trading below its book value per share and is undervalued in my view. The company’s NTM Total Enterprise Value / Revenues ratio is 1.30x and has remained low for some time. The company is undervalued according to the metric. If market sentiment remains positive on the company and continued improved financial performance is reported, then the stock price may continue to rise higher than its valuation. $11 per share represents the next price channel for the trend.
The current trend into the $9 range was caused by a rally over the earning reports. There could be a pullback in price. There are greater risks to consider than the current rally subsiding. Although it has recently entered bullish territory, the stock market remains volatile. The current S&P500 Advance/Decline line for this week indicates bearish sentiment lurking. Major indexes have been overall down trending since August 1st.
I think the company has low risk for a long-term investment. The company operates in a cash-rich environment and its current contracts ensure future revenues. The company expects financial performance to continue to improve over the next year. If the stock price returns to $10 per share, then gains of 7% may be realized. If the stock price enters the $11 price channel over the long term, then gains of 18% may be possible.
Conclusion
I previously rated Helix Energy Solutions a Hold due to poor Q1-2023 financial performance. The company’s Q2-2023 performance showed great improvement and the company’s 2023-2024 outlook indicates continued improvement. The company’s stock price continues its one-year uptrend and is currently undervalued. I change my rating to a buy and recommend a long-term strategy to take advantage of the company’s upcoming performance.
Read the full article here


