Buyers thought Nvidia Corporation (NASDAQ:NVDA) had dropped enough from $481 to $403, and piled into the perceived bargain on Monday, popping the price 7.1% to $437. All of this before earnings are due post-market on the August 23rd. Revenues and earnings are no secret at this point, as the company almost knows now what it is going to report, except for some last-minute window dressing. Unfortunately, we don’t know the earnings, but many analysts are raising their targets. So I guess the guidance they are receiving from the company is making them courageous.
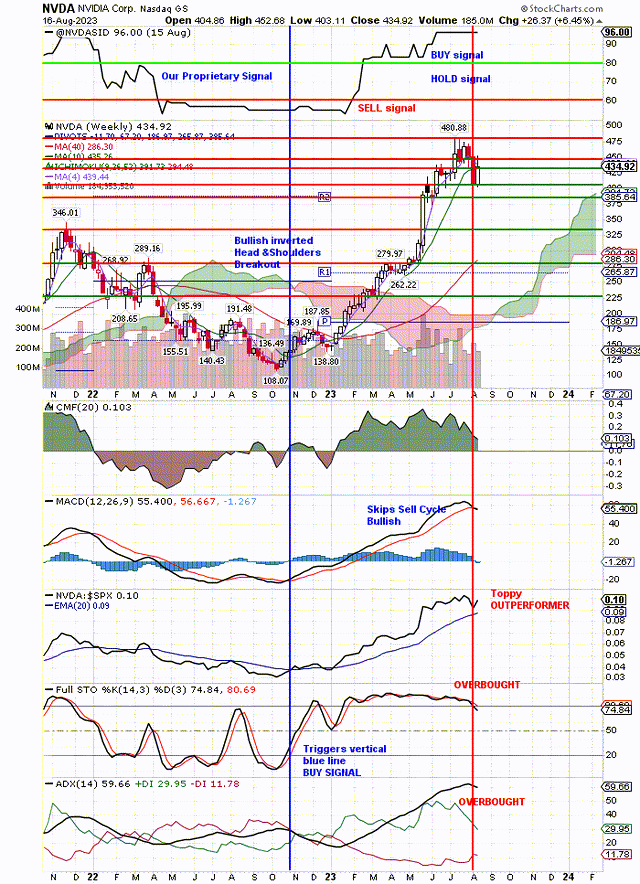
What do we know? NVDA has our very strong, proprietary SID Buy Signal, scoring 96 out of 100. That’s an improvement from a score of 83 in our last article on NVDA. We know that it dropped almost $80 from its recent high, but our Buy signal did not change. We know portfolio managers love to buy on weakness, especially when stocks drop like this and still have a strong Buy Signal. So no surprise that it popped when it reached down to $403 support. This support line is shown on the chart below. The size of the price move up was a surprise, because Portfolio Managers don’t chase price higher like this. It looks more like short covering, panic buying.
Assuming most of the shorts covered on Monday, I would expect resistance to stop this move up, unless the earnings have leaked out and are really great. In that case, price could probably go back to the $481 high. As you can see on the weekly chart below, price hit resistance at $450 and is dropping back to retest support. The rush to buy is over and the traders have decided to take their profits and wait for the next bounce.
Investors, on the other hand, will be buying the pullback to test support. The Portfolio Managers have to wait for this weakness to buy. They would prefer to buy after earnings come out. However, with so many analysts raising their targets before earnings, some will use this pullback to add to their positions. All of the latest analyst upgrades in targets are already in price, so there is no rush to buy now, and every reason to wait for weakness to buy. Small investors, traders and hedge funds are a different story. They chase price higher.
We know that the buyers came back in at around $400 and stopped buying at around $450. So when will the buyers come in again? Obviously at around $400, but will it go that low again? Earnings expectations are high so the slightest disappointment will see price pull back. We will just watch the signals on the weekly chart below to tell us what to do.
At the top of the chart is our SID, proprietary, strong Buy Signal. That tells us to buy on any weakness. Below that is price and you can see all the moving averages are trending up and positive. The old high at $481 is the target of the current bounce. Buyers at around $400 were expecting to reach that target, but certainly not in one step. It will be interesting to see where they come back in and you can see the horizontal support lines that we have drawn where we expect the buyers to come back.
The next support is between $425 and $435. You can see that price has already dropped to the top of that range. The next support level is around $400 and we don’t expect price to drop that low before earnings. After earnings we think price will retest $481. If that turns out to be the case, then buying this pullback to support makes sense.
Below price are all the negative technical signals that were surprised by this pop before earnings. As a result of these negative signals we had drawn a vertical, red line Sell Signal that is still in place. However, the surprise jump in price indicates that this signal will probably be reversed.
One of the technical signals has already turned up and that is Relative Strength, because price is now doing better than the Index. It is outperforming. You can see we had labelled this “Toppy Outperformer” because the line was dropping to retest the uptrend. The uptrend has held and now the line is moving back up in a bullish signal. This was an important, positive reversal, telling portfolio managers that NVDA is still and outperformer.
With analysts pounding the table and raising their targets for NVDA, we expect that these negative signals will reverse, just as Relative Strength has reversed and turned up. It seems like the “run for the roses” was started by Morgan Stanley when it raised its target for NVDA. Once that happened, the rest of the analysts had no reason to keep the good news a secret, so fear of missing out kicked in and one, recent analyst target is now $600.
Here is the weekly chart showing the negative technical signals as price dropped to near $400, triggering our red, vertical line, Sell Signal. However, our proprietary SID signal remained a strong Buy Signal shouting “buy on weakness.” That’s because SID is a lagging indicator and, in this case, shows the value of a lagging indicator.
The advantage the portfolio managers and analysts had was that they knew it was a buy on weakness opportunity. So they started buying near $400 and everyone piled on. Professionals pay to get that “first call” but small investors don’t need it. If NVDA is going to $600, does it matter if the small investor gets it at $400 rather than $435? I think the short term target is near the analysts’ consensus target of about $500. A retest of the old high at $481 is certainly possible.
Nvidia Boy On Weakness Signal (stockcharts.com)
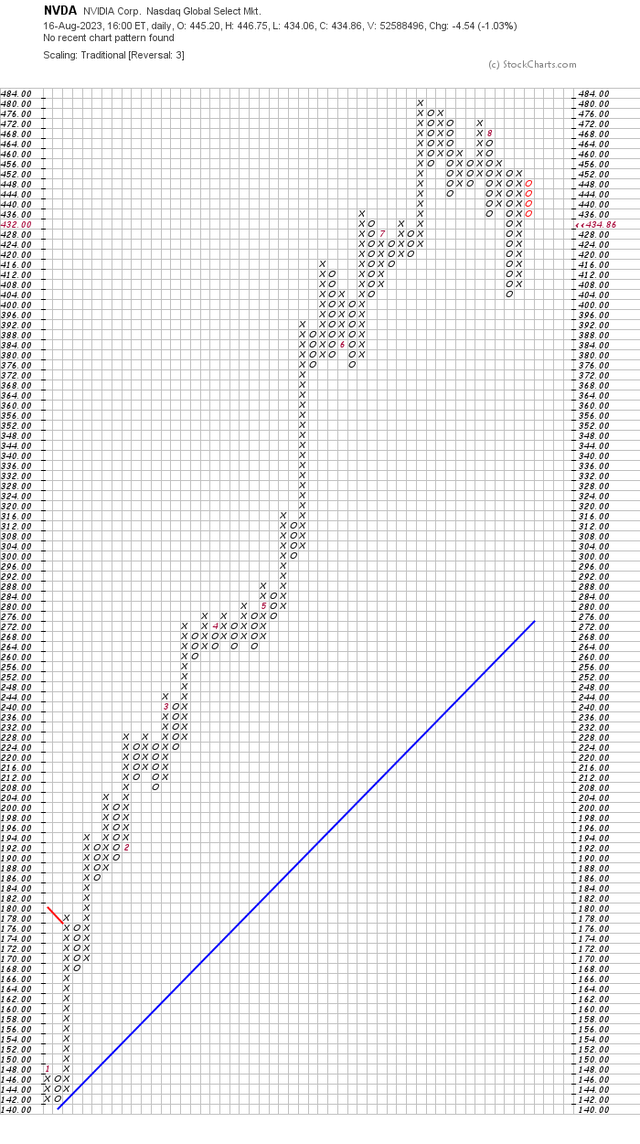
There is an easier and better way to spot support and resistance levels. The Point & Figure chart is famous for doing this for us. The rising column of Xs stop when price hits resistance. The dropping column of Os stops when it hits support. You can easily see the tops and bottoms on the chart below.
The columns on the right side of the chart show the latest action. You can see the Os column dropping to support around $404. Then the big pop after Morgan Stanley announced and the Xs column soars to $452 resistance where it ends. Now you can see the column of Os dropping to $436 looking for support. Notice where previous columns have ended to identify support and resistance levels. There is good support just below $436.
NVDA resistance at $452, price drops to support (stockcharts.com)
Read the full article here


