Intro
HNI Corporation (NYSE:HNI) is a US outfit with interests in both ‘Workplace Furnishing’ and the ‘Residential Building markets. We actually wrote on Kimball (which subsequently has now become part of HNI on the back of its acquisition) back in October of 2020 when HNI shares were rallying aggressively out of their pandemic lows earlier in the year.
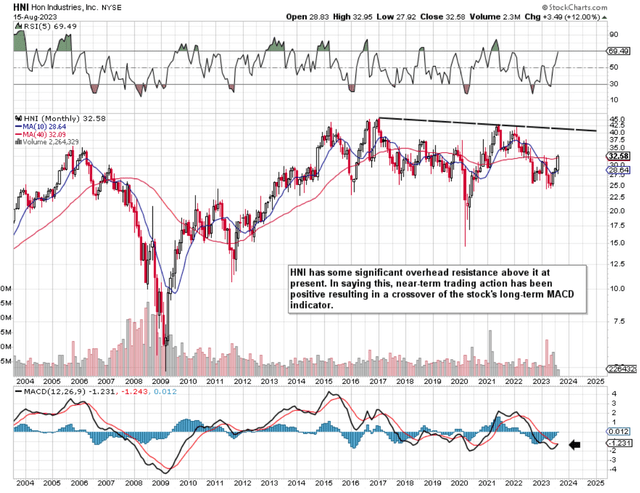
However, shares could not find the wherewithal to push on thereafter (as we see from the long-term chart below) where long-term overhead resistance halted the rally in earnest. In fact, the contraction from that May’2021 top means that shares (when we include dividend proceeds) have only returned roughly 4% over the past 34 months alone. Suffice it to say, this return is a sizable opportunity cost (as in real terms investors have lost money) given the S&P500 is up roughly 30% over the same time period.
HNI Long-Term Chart (StockCharts.com)
Q2 Earnings
However, near-term share-price action has been really encouraging due to Kimball coming on board in recent months and an impressive set of Q2 numbers announced earlier this month. Q2 Non-GAAP EPS of $0.55 easily beat the consensus figure of $0.21 per share. Furthermore, revenues of over $563 million for the quarter beat the consensus target by over $13 million. Although the residential buildings products segment is expected to remain under pressure in the third quarter, the Workplace Furnishings segment is expected to report modest growth in Q3.
Suffice it to say, in what has become a difficult market (volume-wise), ‘Workplace Furnishings was still able to grow its non-GAAP profits by 6% in a market that saw a 15% drop in sales for the quarter. The boost in margin was due to better productivity, successful cost-cutting measures as well as the willingness to double down on areas that had not been working as planned (e-commerce).
Furthermore, the synergy tailwinds from the Kimball purchase plus the decision to liquidate Poppin should favorably impact HNI’s profit profile in the latter part of this fiscal year. On the Residential Building Products side, HNI’s near-term fundamentals remain under pressure due to what has become a weaker housing market. If investors were to foresee a turn here in this market, this would be bullish for the Residential Building Products segment as demand would return in spades.
Dividend Viability
One way of checking the validity of that long-term MACD technical bullish crossover signal is to go through the sustainability of HNI’s dividend. At present, the company pays out a yield of 3.95% based on a forward payout of $1.28 per share. This means HNI’s prevailing dividend yield comes in above HNI’s 5-year average of 3.61%. Many investors use the dividend yield as a barometer on whether shares of the company are undervalued or not so off to a good start here.
Growth though in the payout is pretty mute as we see in the table below. Furthermore, given the inflationary times we are living in presently, growth in the dividend is just as important as the prevailing yield. Both in effect now need to be robust in order to protect the investor’s purchasing power over time.
| HNI Dividend Growth Time-Period | % |
| 1-Year Dividend Growth [TTM] | 2.4% |
| 3-Year Dividend Growth | 1.61% |
| 5-Year Dividend Growth | 2.17% |
Pay-Out Ratio
Over the past four quarters, $55.1 million of dividend payments was paid out of a free-cash-flow kitty of $76.4 million. This means the trailing twelve-month dividend cash dividend payout ratio comes in at 72.12%. Although this ratio is on the higher side of what we usually look for (>65%), it still comes in quite a bit lower than the 5-year average (85.2%) for this metric. The pay-out ratio gives investors the quickest snapshot as to whether a dividend is sustainable or not so again strength can be seen here in terms of affordability.
Debt To Equity Ratio
Cash flow as we know can be generated in a myriad of ways, which is why the balance sheet must also be reviewed to look for discrepancies. At the end of Q2, HNI reported a debt-to-equity ratio of over 104%. This is a sizable increase from the stock’s 5-year average of 51.9% which means Kimball in particular will have to start delivering sooner rather than later. The reason being is that HNI’s interest coverage ratio has dropped from a 5-year average of 15.5 to a trailing 12-month average of 8.88. Suffice it to say, a lower interest coverage ratio means it may be more difficult to keep on increasing the dividend due to ongoing debt payments.
Forward Look Earnings Revisions
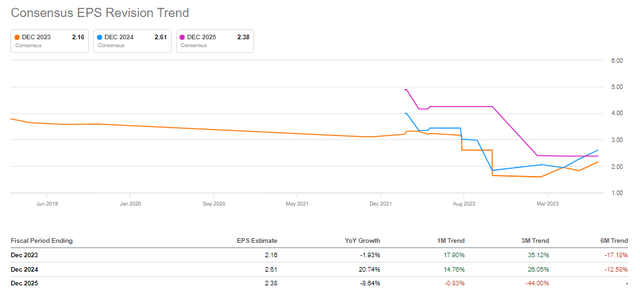
What is encouraging however is how forward-looking EPS revisions have been increasing in recent months both for this year as well as next year. In fact, over the past month alone earnings estimates both for fiscal 2023 as well as fiscal 2024 have increased by 17%+ & 14% respectively. Suffice it to say, based on these projections, forward dividend pay-out ratios should decline significantly (down to 59.2% for example for fiscal 2023 alone) on current dividend payments ($1.28 a share).
HNI Consensus EPS Revisions Trend (Seeking Alpha)
Conclusion
To sum up, HNI’s dividend looks in solid shape at present due to it being well covered by free cash flow which should only grow if growth estimates are realized. In saying this, due to more debt having come onto the balance sheet, HNI is now under more pressure to actually report growth every quarter. The stock’s interest coverage ratio in Q2 (6.5+) actually trailed the annual average so this will be a trend that will be watched carefully by investors going forward. We look forward to continued coverage.
Read the full article here


