When evaluating large-cap returns against small caps, the small-cap index one chooses is important. Essentially, one can evaluate small-cap returns as measured by the Russell 2000 Index or small-cap returns measured by the S&P 600 Index.
The difference between the two indices rests in their construction with S&P’s inclusion criteria consisting of “positive earnings, liquidity and public float results in the constituents of the S&P Smallcap 600 Index being more profitable, more liquid and more investable than those of the Russell 2000.”
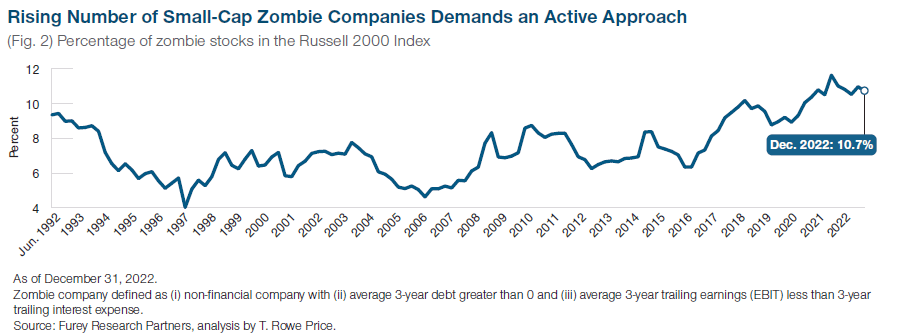
S&P’s profitability criteria seems to be an important difference in the S&P 600 Index’s outperformance. For the Russell 2000 Index, over 10% of companies are what some call Zombie companies, those companies that struggle to pay the interest on their debt.
The T. Rowe Price report referenced below notes not all unprofitable companies are bad investments, but with interest rates much higher than a year ago, debt service for some of these firms might be challenging going forward and result in weaker stock returns. S&P’s profitability criteria for the S&P 600 Index is an effort to avoid some of these firms.
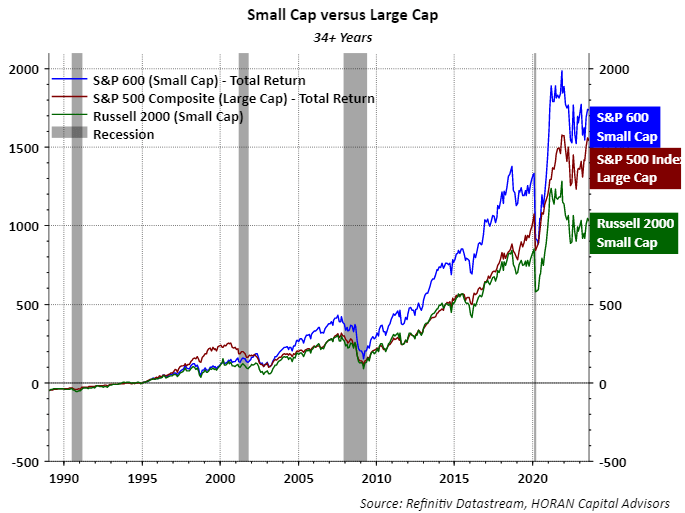
Over a long period of time, thirty-four years in this case, small-cap stocks, i.e., the S&P 600 Smallcap index, have outperformed large company stocks as seen in the below chart.
The S&P 600 Small Cap Index is represented by the blue line on the chart and this small cap index has outpaced the large-cap S&P 500 Index as well as the Russell 2000 Index.
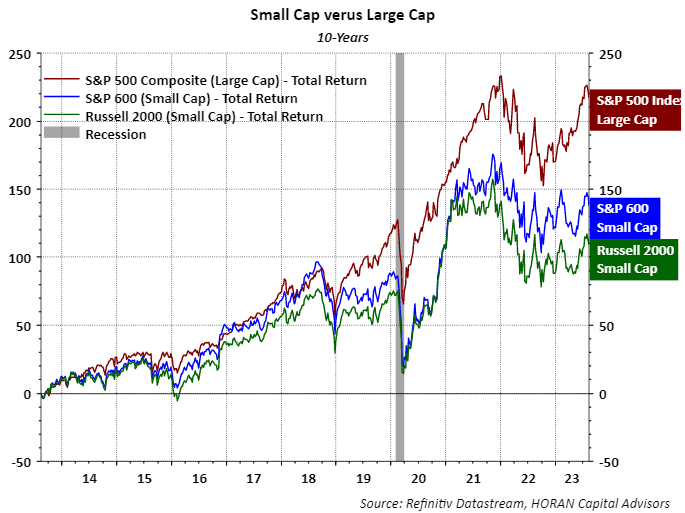
Over the past ten years though, since near the end of 2013, small-cap stock performance has lagged the large-cap S&P 500 Index by a pretty wide margin as seen in the next chart below.
In a recent report from T. Rowe Price, The Outlook for U.S. Smaller Companies Looks Increasingly Compelling, the report highlights a number of factors supporting the potential opportunity in small-cap stocks.
- “While the U.S. equity market has become increasingly concentrated at the top end over the past decade, smaller‑company valuations are at their most compelling levels in decades.”
- “History shows that as high concentration in the S&P 500 Index begins to unwind, a new cycle of small‑cap outperformance usually begins.”
- “Shifting trends in the U.S. economy are particularly supportive of smaller companies, providing a potential catalyst for higher earnings growth.”
The T. Rowe Price report highlights the strength of the services sector of the U.S. economy and smaller companies are more oriented towards U.S. economic activity. Additionally, with the passage of several bills in Congress that support capital spending projects in the U.S., this too should benefit smaller U.S. firms.
Historically, small-cap stocks tend to trade at higher relative valuations than large caps, but small caps are trading at a steep discount to large caps at the moment.
Investors should keep in mind valuation alone is generally not a catalyst to drive stock price outperformance, or underperformance for highly-valued stocks. The lower valuation does provide some downside support in a market pullback though.
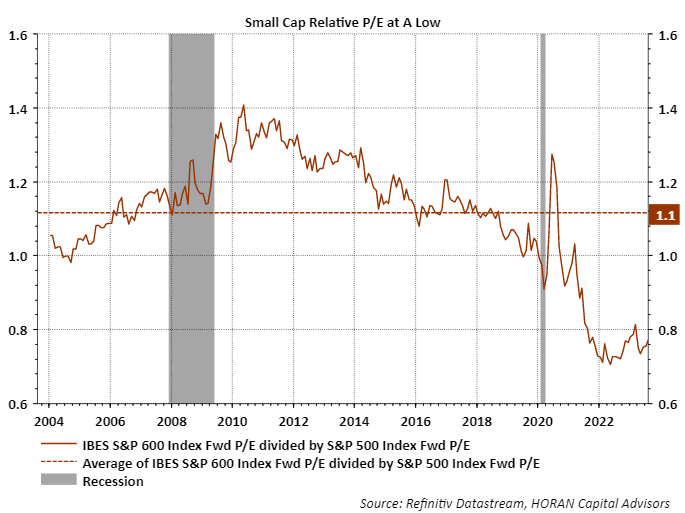
Finally, even though small caps seem compelling at the moment, they can lag the market for an extended period of time. In looking back, some strategists had a favorable view on small caps coming out of the pandemic in 2020.
Small-cap stocks did outperform for a brief period of time, but large-cap stocks returned to better performance by mid-year 2021. At the end of the day, small-cap stocks look attractive, especially with the current dominance of mega-cap stocks, but patience will be needed by investors in order to enjoy the potential rewards of an allocation to small-cap companies.
Original Post
Editor’s Note: The summary bullets for this article were chosen by Seeking Alpha editors.
Read the full article here


