While I certainly understand the need for retirement income, many retirees with substantial assets and income from Social Security and pensions still get convinced (brainwashed?) into thinking that they need to overemphasize dividend income (yield) simply because they’re “retired.” Typically, this “strategy” causes them to significantly lag the returns that the broad market is more than willing to give them had they just built a more well-diversified portfolio and held onto it through the market’s ups-n-downs (which is exactly what I advise investors do). That’s why I have been so surprised that the endless stream of articles on perennial dogs like Exxon (XOM) and AT&T (T) so often grace Seeking Alpha’s “Trending Analysis” on the homepage leader board. Indeed, I wrote a Seeking Alpha article on this topic that achieved some success (and many naysayers) specifically about this topic: Retirees Beware: Dividend Investing Is Overrated.
And, despite all the bullish articles on Enbridge – and readily admitting that I wrote some of them – today I argue that Enbridge (NYSE:ENB) is yet another example of what I’m talking about here, and the chart below proves it:
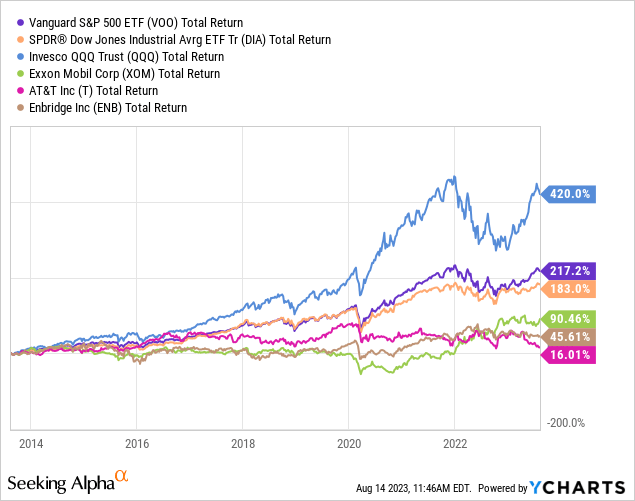
As can be seen in the graphic above, and despite ENB’s strong dividend growth and its current 7.2% yield, the 10-year total returns (just like XOM and T) have been relatively abysmal in comparison to the broad market averages as represented by the Vanguard S&P 500 ETF (VOO), the SPDR DJIA ETF (DIA), and especially the Invesco Nasdaq-100 Trust (QQQ).
Investment Thesis
My followers know that I’m a big fan of a top-down capital allocation strategy – one that divides a portfolio into various categories and then allocates capital according to each individual’s personal considerations (goals, retired/working, comfort level, etc.). Personally, I recommend the S&P 500 be the foundation of any portfolio, given the vast majority of individual investors (and even the majority of professional money managers) fail to achieve the average annual returns of the S&P 500 over the long run.
Other categories might be “Growth,” “Technology,” “Sectors,” “Energy,” and, for example, the one we will be talking about today: “Dividend Growth/Income.” After retiring at 45, I’m a big fan of dividends, and get the majority of my dividend income from energy stocks like Exxon, Chevron (CVX), ConocoPhillips (COP), Phillips (PSX), and – yes – even Enbridge. That being the case, the “Energy” and “Dividend Income” categories within my own personal portfolio are effectively merged.
But let’s get back to Enbridge. I inherited ENB shares when Spectra Energy sold out. While Enbridge did keep its promise with respect to dividend growth in the years immediately following the merger, I’m sure many former Spectra shareholders would agree with me that they would likely have been much better off had Spectra remained an independent company. But, then again, former Spectra CEO Greg Ebel has taken over as President and CEO of Enbridge… so that’s how that works… sometimes.
Returns
The primary investment thesis for ENB is income and – at least it was – excellent dividend growth:
Enbridge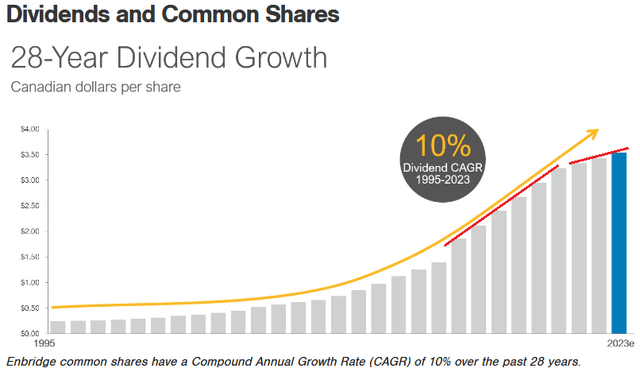
The red line with the strong upward slope were the dividend commitments made to shareholders with respect to the Spectra merger (completed in February 2017). However, since those commitments were met, note the dividend increases have been less than impressive. Indeed, the last dividend increase was only 3.2% – despite the fact that DCF grew by 9.3% from 2021-2022. But hey, like I said, at least the merger got done, right?
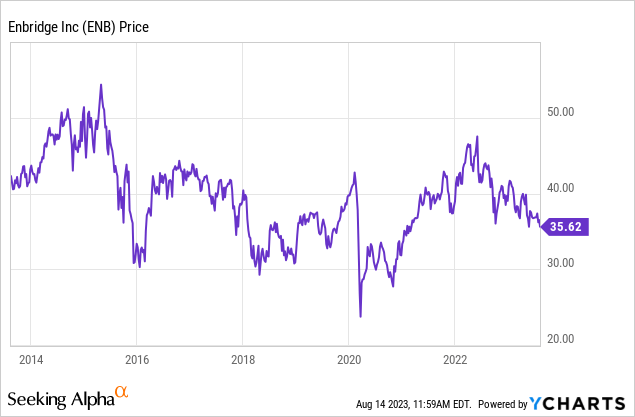
But of course, income is only part of the total returns equation. And from a stock-price appreciation standpoint, ENB’s 10-year track record is, in a word, pitiful. The stock is currently below where it was 10 years ago:
And I should know… I own the damn stock and, right along with Exxon, there were many years (in a row) when both stocks were at the very bottom of my investment spreadsheet (during the biggest bull-market of my life).
Payout Ratio
As most all of you know, Enbridge is a pipeline oriented company that gets the majority of its cash-flow from liquids and natural gas pipelines. It also has renewables operations and it owns the Union Gas utility company in Canada. The point is that the majority of ENB’s cash flow is stable and supported by long-term energy delivery contracts (98% of contracted volumes are cost of service fees) with 80% of EBITDA having built-in inflation protection. All this is good.
What isn’t so good is that ENB had for years been targeting a 60% payout ratio, a somewhat low and relatively arbitrary choice for a midstream company with such a large percentage of fee-based and inflation protected cash flow. However, ENB has big growth plans, and they advertise its growth plan as being “self funded.” But as long-time ENB investors know, the company has a track record of somewhat pushing on the growth string which on multiple occasions resulted in tying up billions in shareholder capital in large-scale pipeline projects that got hung up in court – adding significant additional expense to the project’s original bright-n-rosy costs/returns estimates. In addition, though the company says it’s “self-funding” growth, debt continues to grow as well.
Debt
Certainly, ENB took on additional debt as a result of the Spectra takeover. However, according to Seeking Alpha’s balance sheet summary, ENB’s debt has continued to grow since the Spectra merger was closed in 2017:
Seeking Alpha
Indeed, the company has added an estimated $5.3 billion in additional debt since the merger closed and currently has a whopping $54.76 billion in total long-term debt. And while the company likes to toot its horn about its current 4.7% Debt-to-EBITDA ratio being in the “lower half” of its target range (i.e. 4.5%-5.0%), the company still has to pay interest on that debt. Last year, the interest paid on ENB’s long-term debt was $2.15 billion – that’s over $1/share. Note, the 2023 dividend was $3.55/share.
To have a $54.76 billion debt load (more than half its market-cap) is probably not a good idea in the first place. But considering that ENB’s largest segment transports oil sands crude, one could argue that fact puts an additional risk premium on the company’s debt. I say that because investors have to consider that in an age of global warming goosed renewables, clean tech, and EVs that diesel transportation fleets will eventually get electrified. Considering oil sands producers make “heavy” crude, which is an excellent feed-stock for high distillate yield refineries, fleet electrification could have a big impact on demand. And of course, oil sands production in and of itself is considered to be a relatively heavy CO2 emitting industry.
Summary and Conclusions
Enbridge is another in a long line of “income” related investments that, while certainly fulfilling its investment income thesis, has significantly lagged the long-term total returns of the broad market averages. While the current 7.2% yield is attractive, is it really so attractive as compared to my ~5% yielding money market fund such that I will risk tying up capital in a company that so significantly lags the broad market averages, has an arguably high debt-load, and could very well face some existential threats from EVs and global warming? I will leave that up to the individual investor to consider as a homework assignment.
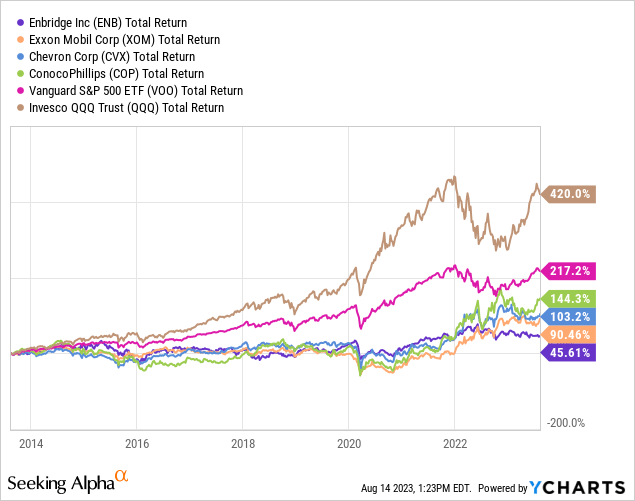
Meantime, I’ll end with a 10-year total returns chart of Enbridge in comparison Exxon, Chevron and ConocoPhillips (COP) – all companies that pay decent dividends and yield 3.3%, 3.8%, and 3.9%, respectively. Note that even ExxonMobil’s 10-year returns have nearly doubled the total returns of Enbridge:
Bottom line:
Is Enbridge overrated? You bet it is. And the next time it gets above US$40, I will start selling my shares before it – once again – retreats back from that level. Just as it had, to my dismay, many times in the past.
Read the full article here


