Last week’s article called for a drop in the S&P500 (SPY) to test 4448-58. Considering this week’s low was 4444, it wasn’t a bad call. However, I won’t pretend I ‘nailed’ the market. The sequence of failed rallies and new lows was a challenge to trade and I expected a larger recovery into the end of the week.
The slow bleed lower can be partly explained by the weekly exhaustion pointed out in previous articles, made worse by Opex. In any case, it poses a number of questions. Has 4448-58 support held? Can we still expect a solid bounce? What are the risks of a collapse?
To answer these questions, a variety of tried and tested technical analysis techniques will be applied to the S&P 500 in multiple timeframes. The aim is to provide an actionable guide with directional bias, important levels, and expectations for price action. The evidence will then be compiled and used to make a call for the week(s) ahead.
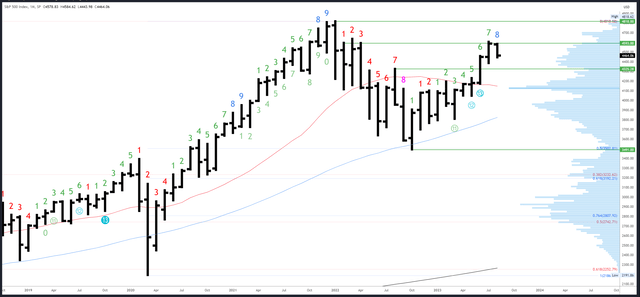
S&P 500 Monthly
The first monthly reference at 4450-58 was tested this week and held.
There’s not much to add to last week’s commentary and the monthly chart continues to provide a useful bullish bias. The strong close of the July monthly bar created a ‘weak’ high which should be exceeded before any significant correction develops. At some point in August (perhaps September), we can look for a break above 4607.
SPX Monthly (Tradingview)
Monthly resistance is 4593-4607. 4637 is the next level above, then the all-time high of 4818.
4450-58 is the first reference on the downside at the June close/July open and the June high. 4385 is also potential support at the July low, with 4325 a level of interest below.
The monthly Demark exhaustion signal has now moved on to bar 8 of a possible 9 in August. We can expect a reaction on either bar 8 or 9 (or even the month after bar 9), but usually only when higher highs are made.
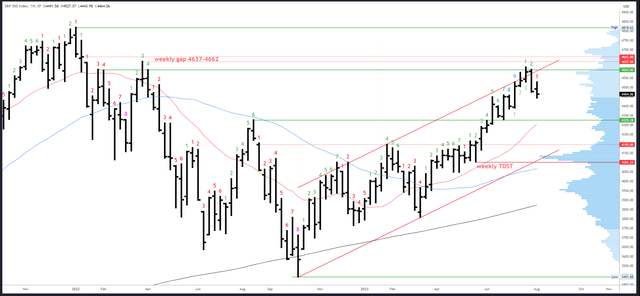
S&P 500 Weekly
Another bearish weekly bar was formed this week with a lower low, lower high and lower close. This isn’t usually how a reversal sets up, but anything is possible (the 2022 bear market low came from a bar with the same properties) and at least the close was off the low unlike the previous week.
A close under 4444 would be bearish and likely lead to 4385-89.
SPX Weekly (Tradingview)
4607 is the first major resistance. Above that, the weekly gap from 4637-62 is the next target and could fill later in August.
The break-out area of 4448-58 is initial support, followed by 4385-89 and 4325.
An upside (Demark) exhaustion count has completed and is having an effect. A new downside count will be on bar 2 (of 9) next week.
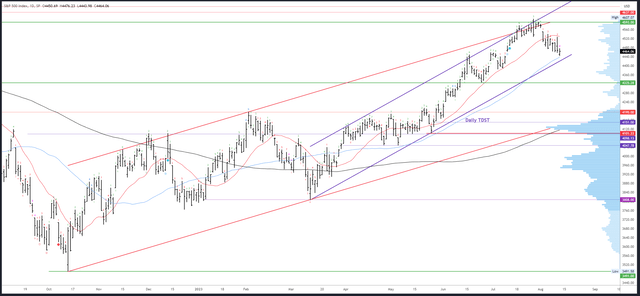
S&P 500 Daily
The broken 20dma could not be reclaimed and nearly marked the high of the week at 4527 on Thursday. Price is now working its way to the next moving average and Friday’s low came very near the 50dma at 4438 which will rise to 4444 on Monday. Channel support is just below and will be at 4428 on Monday.
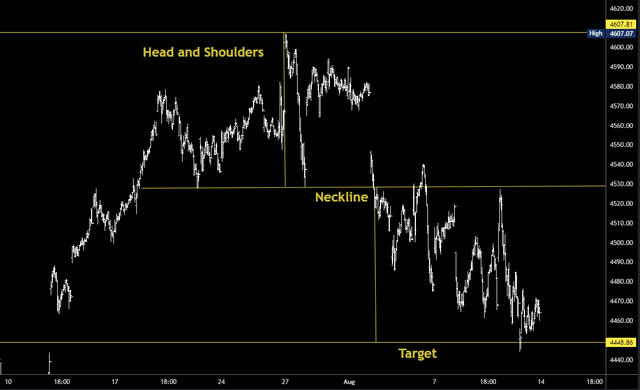
Friday’s slight recovery is a potential positive sign but it may have come due to short covering as the small head and shoulders pattern hit its target.
SPX Head and Shoulders (Tradingview)
A full reversal needs further strong bars and follow through to the upside through 4476.
SPX Daily (Tradingview)
Initial resistance is 4527, then 4551.
As pointed out earlier, the 50dma and channel are initial support and line up with 4439 gap fill from 11th July. 4385-89 is the next support area below.
Downside Demark exhaustion is now in play. As pointed out last week, “should weakness continue, bar 8 could register on Friday and lead to a bounce.” Bar 9 (of 9) will register on Monday with a close below 4499 and this should limit the downside.
Events Next Week
Inflation data last week was cool enough to keep a pause from the Fed firmly on the table for September, although the odds of a hike have climbed from 1% to 10%.
Longer-term yields are now more of a concern than Fed tightening, as is US dollar strength, but both are approaching resistance (2022 high and 200dma respectively).
Retail sales on Tuesday and FOMC Meeting Minutes on Wednesday are the highlights of a quiet week for data.
Probable Moves Next Week(s)
The most probable outcome is that an interim bottom is struck next week for a recovery rally. Indeed, the low could already be in at 4444, which was very near the 50dma and just under my ideal target of 4448-58. With daily downside exhaustion now active, rallies should be able to hold gains longer than they did last week. 4551 is the initial recovery target.
Any brief new low under 4444 can be viewed as bullish as long as it closes back over 4444 and leads to stronger action. A continued slow bleed like last week with lower lows and lower closes would frustratingly target 4385-89.
Managing risk is always a primary concern and while the probabilities of a collapse seem low, I should cover that possibility. Should any session make a large gap down to new lows below the channel and 50dma and then fail to close the gap, get out of the way as it could quickly flush to 4325.
This isn’t my expectation, but at least I will be prepared and can adjust if it should happen. Technical analysis is partly prediction, partly reaction.
Bigger picture, I do not think the top is in at 4607. The weekly gap from 4637-62 is a viable target later this month or in September, and a healthy consolidation in the coming weeks and months could eventually propel the S&P 500 to new all-time highs.
Read the full article here


