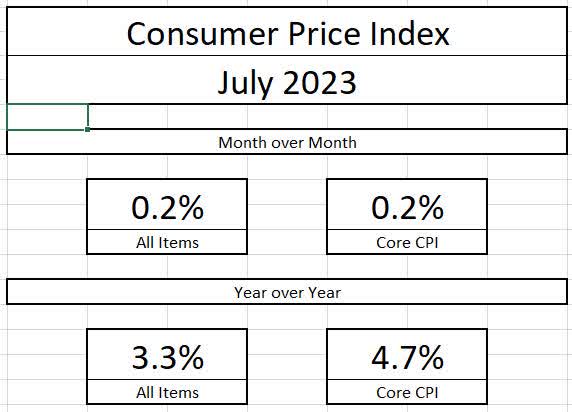
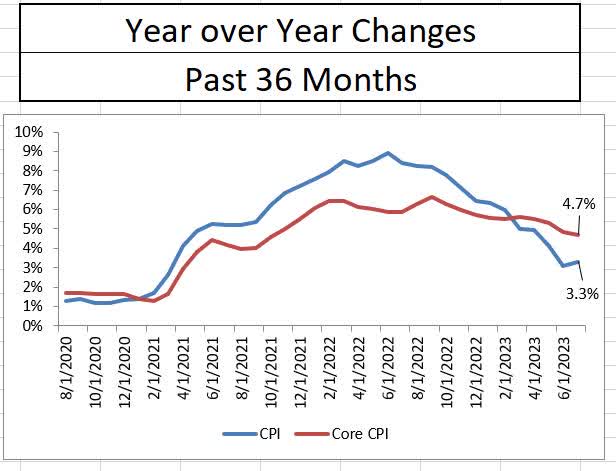
Earlier today, the Bureau of Labor Statistics released the inflation report for the month of July. For the second consecutive month, broad prices rose at a rather tame rate. Headline inflation rose 0.2% for the month and 3.3% year-over-year while core inflation (which is headline less food and energy) rose by the same month over month amount, but remained stubbornly elevated at 4.7%.
Bureau of Labor Statistics
Bureau of Labor Statistics
Bureau of Labor Statistics
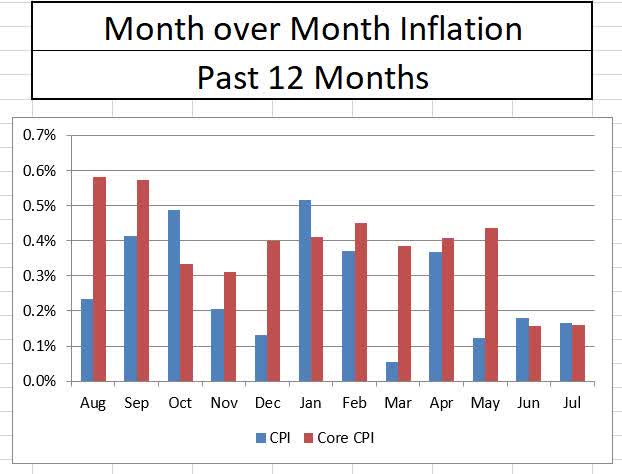
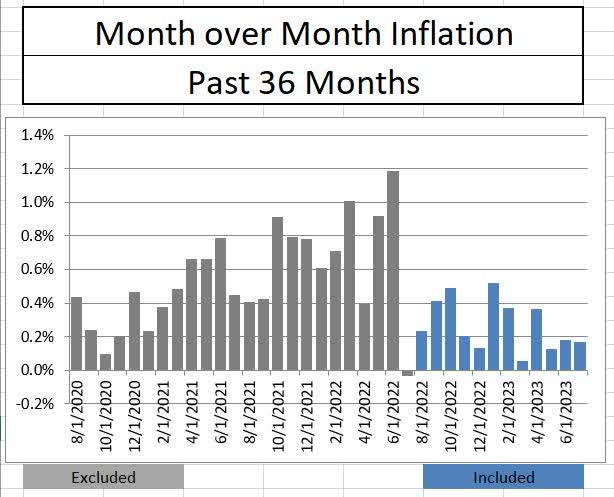
The July inflation report seems to confirm that disinflation has arrived in the US economy. This can be seen from a number of angles. First, the month-over-month headline inflation numbers included in the current year over year inflation data are vastly different compared to the month over month changes in late 2021 or the first half of 2022.
Bureau of Labor Statistics
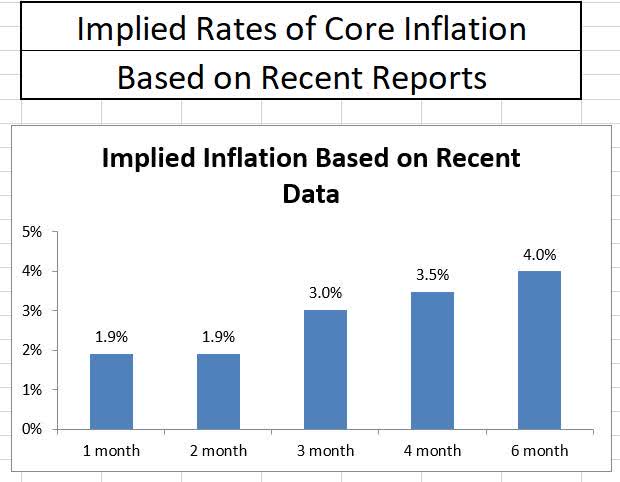
Second, the last six months of core inflation reports show continued deceleration of pricing from current levels. If we annualize the last two inflation reports, core inflation is under the Fed’s long-term target of 2%. This is certainly promising. Even the last six months of inflation data when annualized show a drop in core inflation from the current levels, although it’s not quite at a pace anyone expected.
Bureau of Labor Statistics
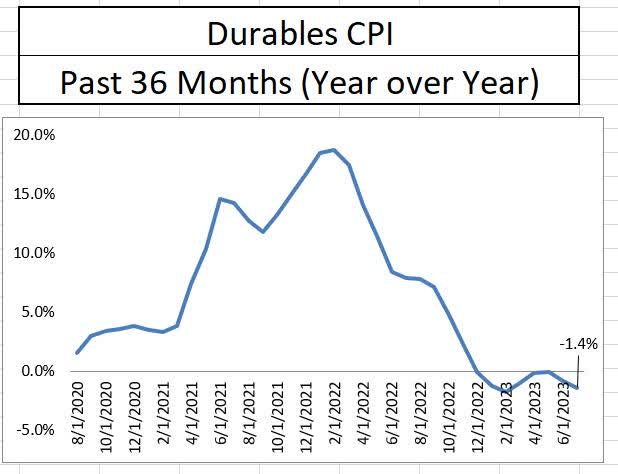
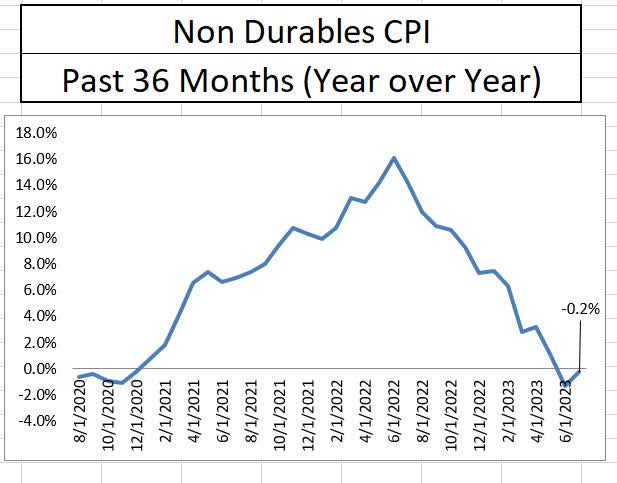
Several sectors continue to support disinflationary pricing in the economy. Early in the battle against inflation, the source of pain came from goods. Now, both durable and nondurable goods have been in a year-over-year deflationary trend for the second consecutive month. Energy continued to help as well with year-over-year pricing down a noticeable 12%. An additional category gave an unlikely assist to pricing in July when medical care posted the first year over year price decrease in this business cycle.
Bureau of Labor Statistics
Bureau of Labor Statistics
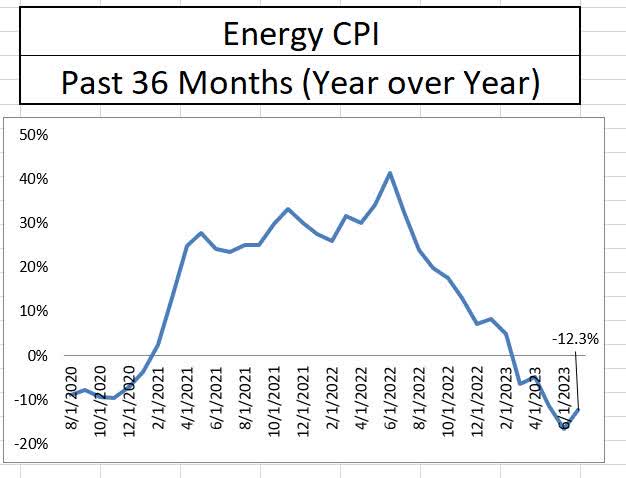
Bureau of Labor Statistics
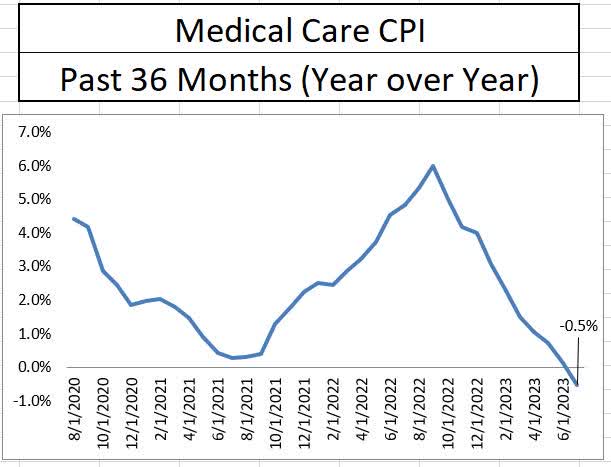
Bureau of Labor Statistics
Despite the progress with goods, energy, and medical care, other sectors continue to show a stubborn “stickiness” in price increases. Food inflation is moderating and far from the cycle highs of over 10%, but the year-over-year price increase of 4.9% remains higher than the tame 1-3% range experienced during the previous business cycle.
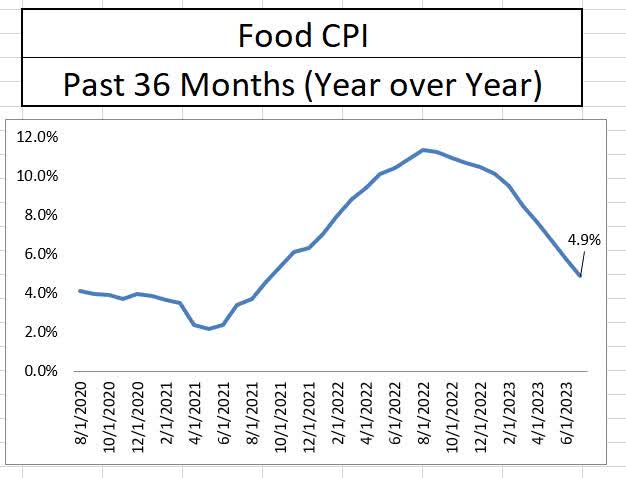
Bureau of Labor Statistics
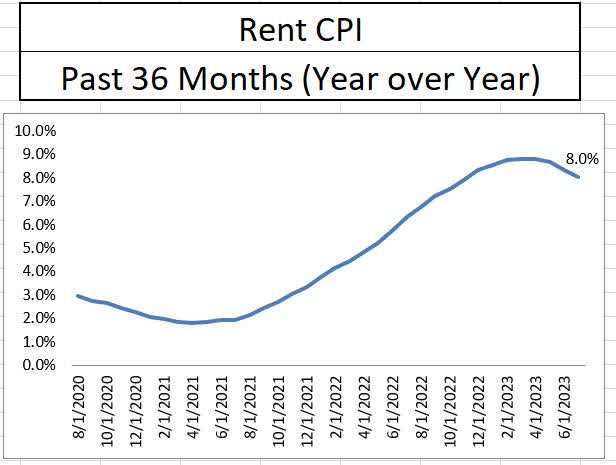
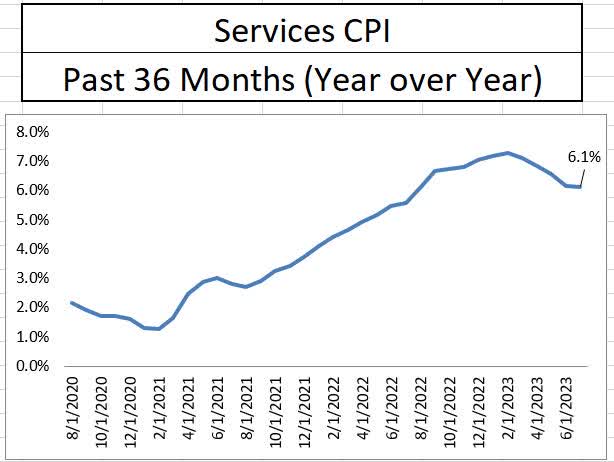
Housing and rent inflation have each come off of their highs from this business cycle, but both remain higher than double the typical housing/rent inflation from the previous cycle. Furthermore, each of these inflationary levels continues to grow at a faster pace than wages, which puts pressure on the consumer. Services is no different than housing and rentals. At 6.1% year over year, the price of services is still growing more than twice as fast as it did on average during the last business cycle.
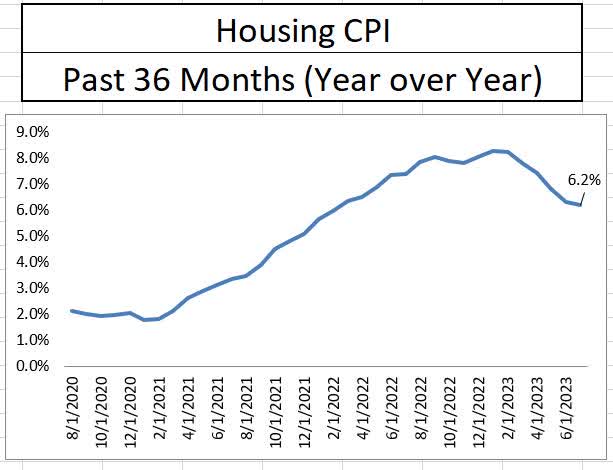
Bureau of Labor Statistics
Bureau of Labor Statistics
Bureau of Labor Statistics
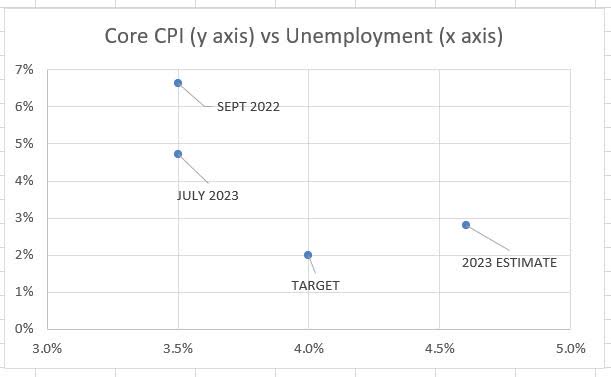
The mix of deflationary and inflationary forces creates a conundrum for the Federal Reserve, especially when incorporating unemployment into the mix. The unemployment rate remains below the long-term target of the Federal Reserve due to a labor shortage. The labor shortage creates wage pressures as employers seek to attract workers by offering higher wages. This in turn leads to more consumption and higher prices. When mapping out the dual mandate on a Phillips Curve, the Fed remains above its target for price stability and below its target on unemployment, giving it the justification it needs to keep interest rates above average for an extended period of time.
Bureau of Labor Statistics & Federal Reserve
The combination of June and July’s inflation reports show that price stability is beginning to get under the control of the Federal Reserve. Disinflation continues despite certain sectors of the economy, like housing and services, continuing to experience abnormal price increase pressures. These pressures, combined with wage pressures due to a labor shortage, will limit the probability of the Fed reducing interest rates in the near term.
Read the full article here


