July Headline CPI came in at +0.2%, in line with expectations, while the Core CPI rate also printed +0.2%. On a year-on-year basis, the Headline figure was +3.2%, slightly less than the +3.3% estimate, while the Core rate was +4.7%, as expected. Last month’s CPI report marked the end of a streak of 12 consecutive lower monthly declines in the Headline rate.
Overall, there wasn’t much in the way of surprise in the consumer price report for last month, but it did mark the lowest annual increase in U.S. inflation since October 2021, something the Fed certainly wants to see. But perhaps more important at the bottom of the hour was a bit of a jump up in last week’s Initial Jobless Claims figure, but Continuing Claims was soft versus what economists were expecting.
July CPI: About As Expected
Christian Fromhertz
Headline CPI Rate Bumps Up in July, Core Rate Falls
Holger Zschaepitz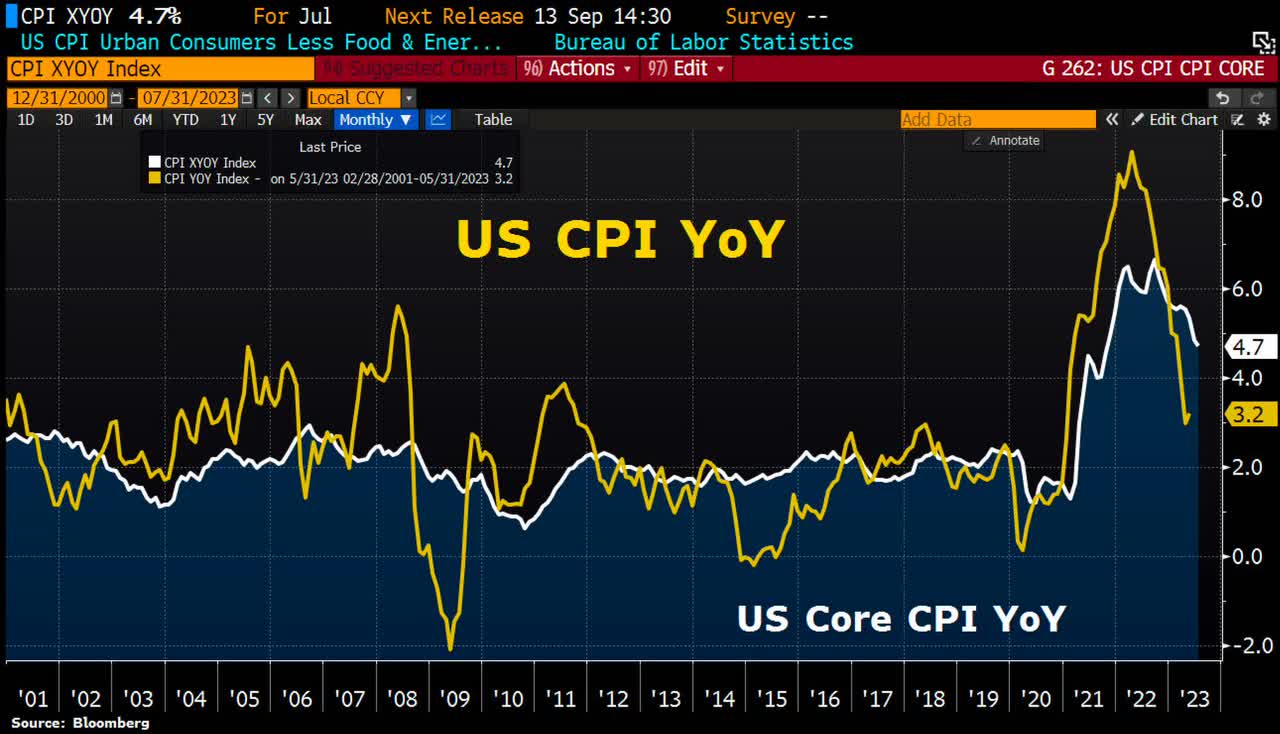
CPI Breakdown by Component
Liz Young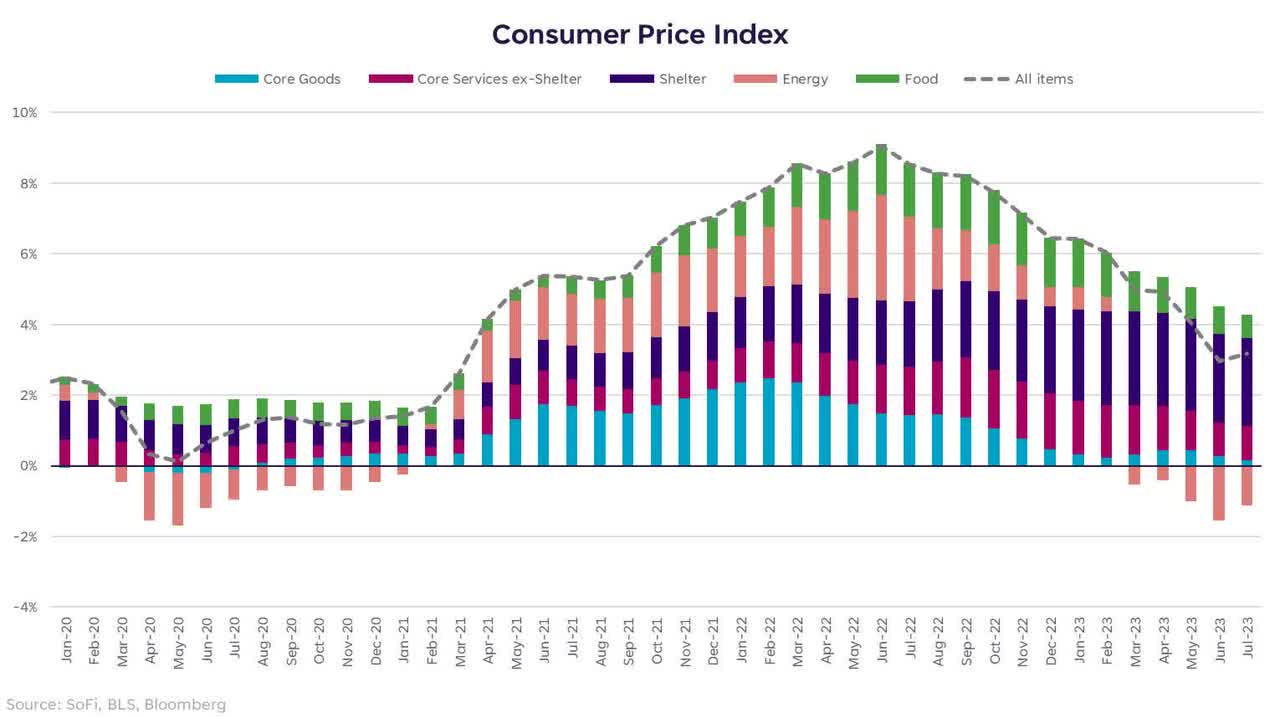
Overall, before the release of the CPI inflation report, the market had estimated a 13% likelihood of a Fed interest rate hike occurring at the September meeting, and the probability of a rate hike in November was about 35%. However, after the release of the CPI data, those probabilities decreased to 8% for the September meeting and 27% for November. This shift suggests that the market now perceives a reduced likelihood of imminent rate hikes by the Fed after today’s in-line inflation marks.
In terms of market response, Treasury yields dipped a bit, while the U.S. dollar ticked to the downside in a risk-on trade while equity futures held their pre-market gains. Something to watch for in the August CPI report will be how much rising retail gasoline prices find their way into the overall price index. The average price of a gallon of regular unleaded gasoline in the U.S. increased gradually throughout July, rising from around $3.54 at the beginning of the month to $3.76 at the end, as reported by OPIS, an energy-data and analytics provider.
As for stocks, heading into the inflation report, the S&P 500 (SP500) had been seeing fewer massive moves. According to Bloomberg, the S&P 500’s 1-day moving post-CPI has been less than 1% in all but one instance dating back to December of last year.
Light Realized Volatility on CPI Days in 2023
Bloomberg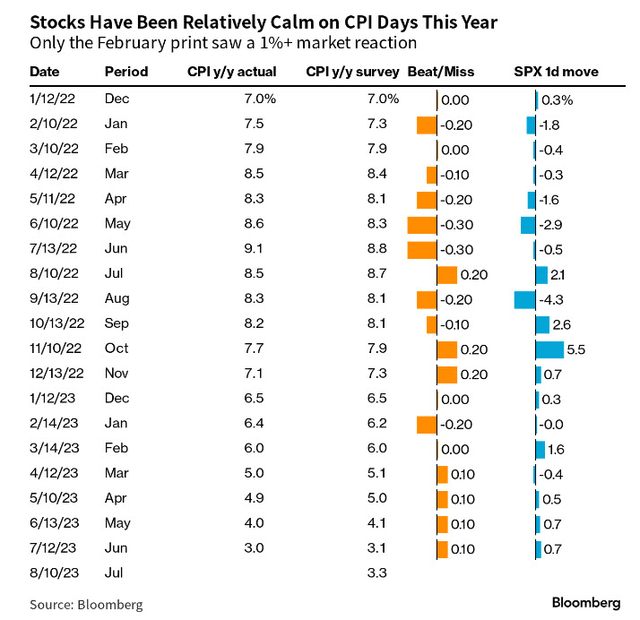
Economists’ Forecasts Have Been Close to What CPI Has Printed This Year
Jim Bianco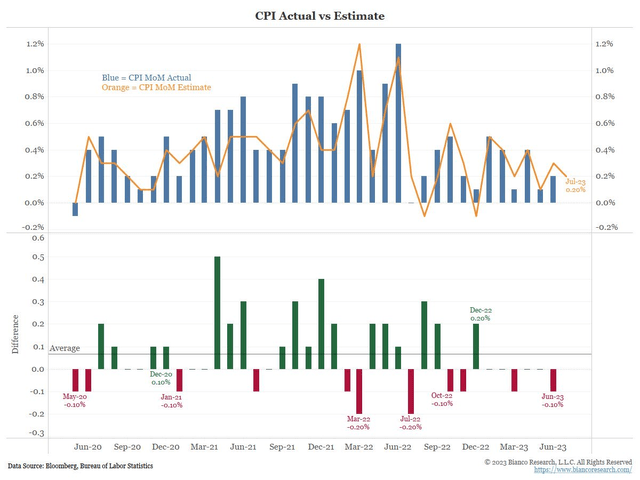
But I noticed that the 1-day VIX index, a gauge of expected volatility for the current trading day, is actually at its highest mark since late May, so we could see a somewhat high SPX swing today.
1-Day VIX: Highest Since May 25 on this CPI Day
TradingView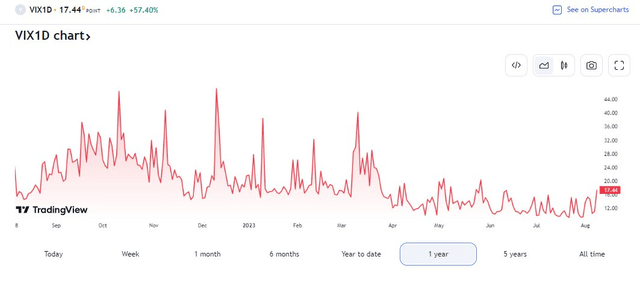
SPX Expected to Rise Slightly Today, Per JPM Estimates
Jesse Cohen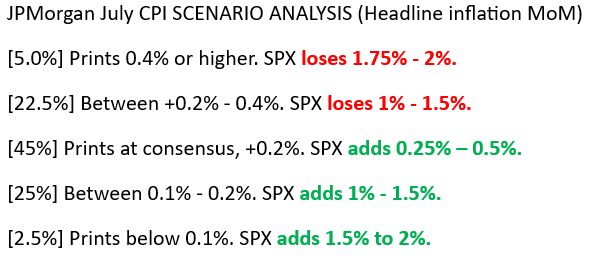
But what could bring about volatility? Commodities. Namely, the cost of a gallon of regular at the pump. As we head into the final few months of 2023, I am bullish on the United States Gasoline Fund, LP ETF (NYSEARCA:UGA).
Bloomberg Commodity Index Going For Its First Positive Quarter since Q1 2022
Liz Ann Sonders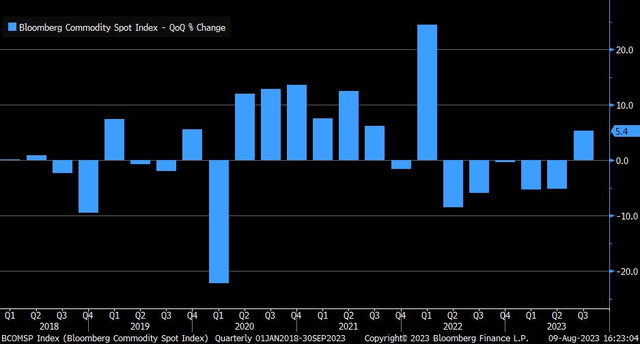
Gasoline Futures Beating Oil Futures in 2023
Koyfin Charts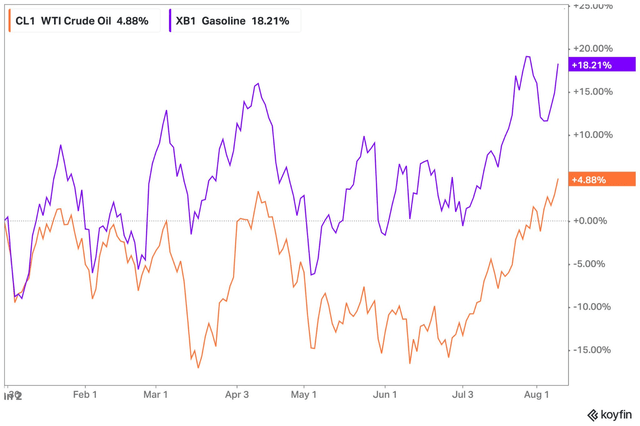
Inflation Expectations Rising as Gasoline Futures Jump
Sober Look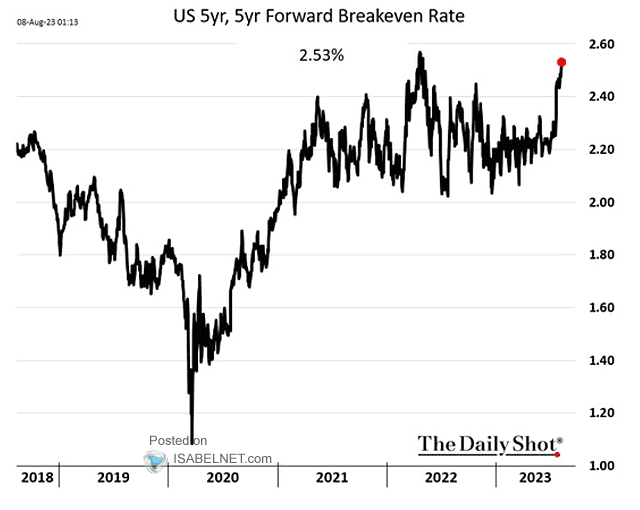
According to the issuer, UGA aims to track the daily changes in percentage terms of the spot price of gasoline, as measured by the daily changes in the price of the futures contract on unleaded gasoline for delivery to the New York harbor, traded on the NYMEX that is the near month contract to expire, except when the near month contract is within two weeks of expiration, in which case it will be measured by the futures contract that is the next month contract to expire, less UGA’s expenses.
UGA features a high annual expense ratio of 0.97% and it is not a very large fund with just $78 million in total assets as of August 9, 2023. Liquidity can be problematic at times – the ETF’s 90-day average daily volume is about 20,000, so using limit orders during the trading day is wise.
Just recently, gasoline futures notched 51-week highs as inventories are at weak levels while demand is decent. What’s more, the price rise in oil has helped the commodity as Gasoline futures hit the highest levels since October. Back in late July, an unplanned Exxon Mobil (XOM) refinery outage at Exxon’s Baton Rouge, Louisiana refinery was another bullish factor.
And just this morning, OPEC raised its 2023 U.S. economic growth forecast from 1.4% to 1.8% as the cartel’s data suggests a 2-million-barrel supply deficit following cuts by Saudi Arabia.
For gasoline itself, HFI Research notes that U.S. gasoline storage levels are printing fresh lows for this time of year compared with the previous 5 years.
Gasoline Inventories At Seasonal Lows
HFI Research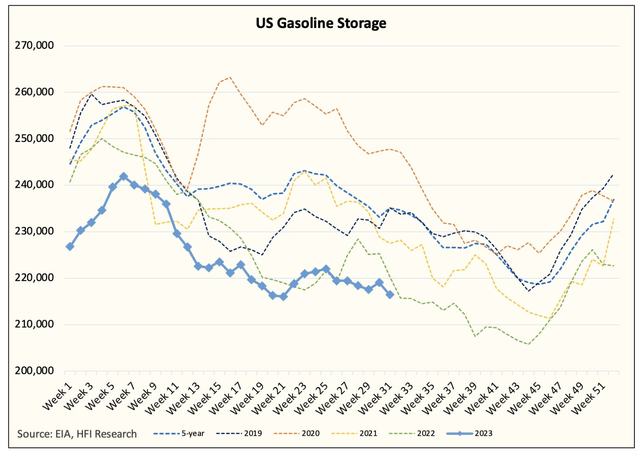
Bullish Bets on Gasoline Futures
Sober Look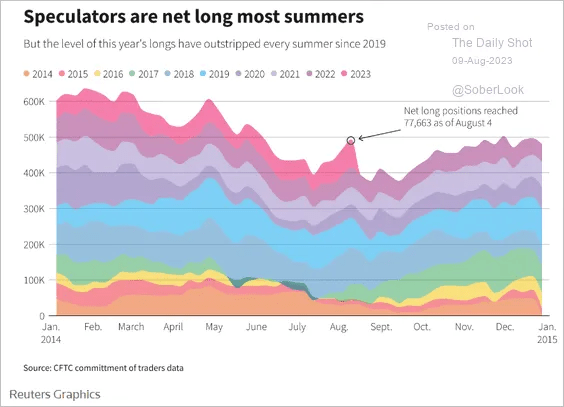
I’ve long preferred trading and investing in UGA, as opposed to something like The United States Oil Fund (USO), since it tracks its benchmark so well. This is due to the term structure of gasoline futures contracts. Whereas WTI Crude Oil Futures (CL1:COM) are sometimes in contango (a situation in which near-term contracts are priced cheaper than longer-dated futures), RBOB is often in backwardation or simply has a flat forward curve.
When the ETF issuer exits expiring contracts, it must then buy later-dated contracts. So, when those contracts to be bought are more expensive (as often happens with USO), the fund’s NAV can suffer. UGA does not encounter that very often, hence the chart below shows how well UGA tracks its index.
UGA Tracking History is Strong, Unliked USO
USCF Investments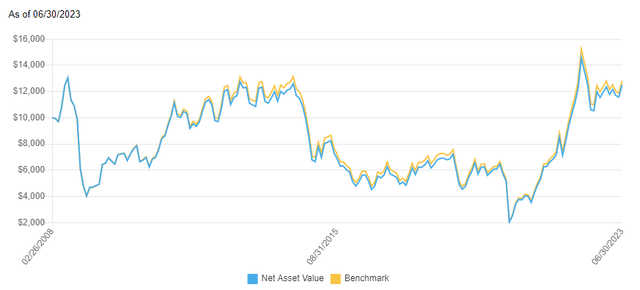
What’s not so encouraging for oil and gasoline commodity longs right now is the seasonal trend. According to data from Equity Clock, UGA has tended to rally from mid-December through mid-June in its 14-year history. So, the mid-August through late Q4 period has not historically brought about significant gains for UGA.
UGA: Neutral Seasonal Trends Through Q4
Equity Clock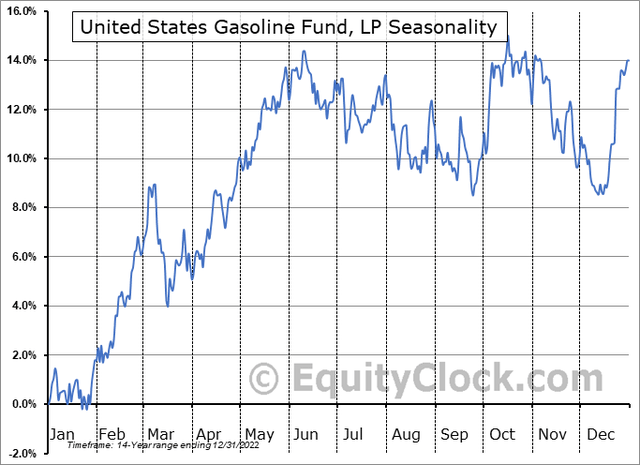
The Technical Take
I see positive price action and strong momentum in UGA. Notice in the chart below that the fund put in a bullish rounded bottom pattern from the third quarter of last year through the middle part of 2023. With a clean breakout above the $65 to $67 range and with a freshly rising 200-day moving average, I assert that the ETF can soon threaten the June 2022 peak near $80.
Certainly, this would put upward pressure on inflation and make the Fed’s job all that much harder. Moreover, if the FOMC is forced to keep its policy rate at a higher level for a more extended period, that would pressure stocks if we do not see a commensurate pickup in economic activity and job growth. So, this is a chart that investors must keep on their radars. A breakdown back under previous resistance in the mid-$60s would be a boon to consumers and the Fed, but price action is strong.
Overall, I see more upside to UGA.
UGA: Bullish Rounded Bottom, Eyeing 2022 Peak
Stockcharts.com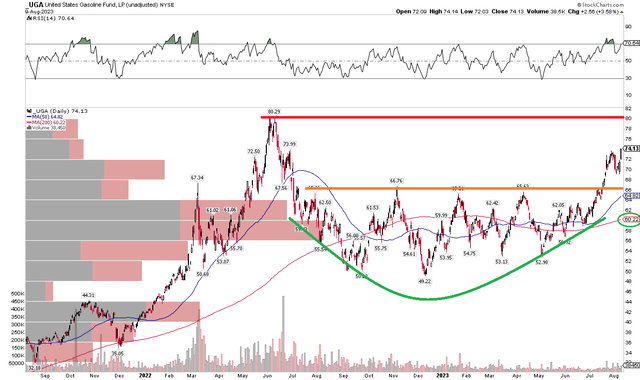
The Bottom Line
Following today’s in-line CPI report, I see broader trends persisting. I have a buy rating on the United States Gasoline Fund, LP ETF as inventories are low and the technical and momentum situations are strong.
Read the full article here


