Thesis
Being a dividend seeking investor, I have grown to like the preferred units that are offered by Dynagas LNG Partners. They offer a very consistent yield that frequently exceeds 9% and has been paid since Q4 of 2015. This provides for a very comfortable landing spot for income seeking investor’s hard earned money.
As I began awaiting my most recent distribution check from Dynagas, I saw my units making impressive gains. I immediately recognized this as the classic dividend chase that happens to many dividend issuing stocks just prior to the dividend payout. I then began to ponder if there was a way to capitalize on everyone else’s thirst for yield. As with all things that are in demand, there is opportunity.
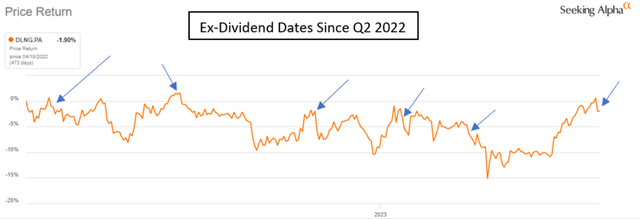
Dynagas LNG Series A Preferred units (NYSE:DLNG.PA) show a trading pattern that has the potential to return over 30% annual returns. This can be identified if the ex-dividend date is plotted on the price chart. This pattern repeatably shows a cycle of price declines following the ex-dividend date of 7%-8% on average. The units ultimately rebound later that quarter in time for the next distribution.
To put my money where my mouth is, I sold almost 40% of my position on the week leading up to the ex-dividend date. This allowed me to harvest a 10% appreciation. This is the same profit I would have otherwise received by sitting on my laurels for the next 365 days. If this pattern is followed consistently, investors could realize a potential annual return of over 30% without collecting a single distribution check.
I know what you are thinking, “This will kill me on taxes!”. The last time I checked I haven’t heard of anyone dying from taxes so hear me out for a few more minutes.
Dynagas LNG Partners LP
Dynagas LNG Partners LP operates a fleet of six VLGC (very large gas carriers) that transport liquified natural gas (LNG). These vessels have a capacity of nearly 150,000 cubic meters of LNG. For those in the U.S., that is over 5 million cubic feet.
The part that makes Dynagas unique is the specialty of their vessels. With the exception of the vessel Clean Energy, the Dynagas fleet is comprised of ice class vessels that are utilized to navigate the Northern Sea Route (NSR). This allows transportation corridors to exist through the Arctic Circle at any time throughout the year because these specialized vessels can operate in areas with ice up to 1 meter thick (3.2 feet). This trade route is a competitive advantage as it provides significantly shorter routes from Northern Europe and Russia to importing countries in Asia and Western Europe.
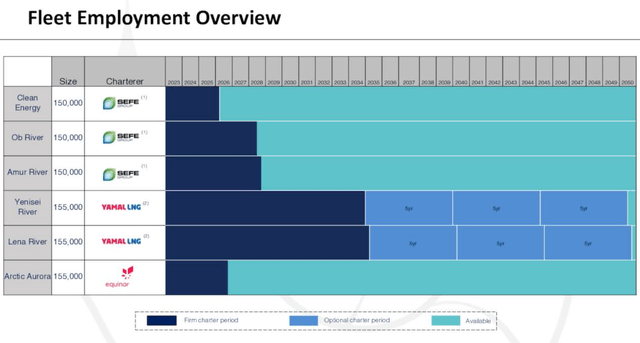
Clearly, this fleet operates in a niche market that very few vessels are able to operate in. As a result, all of the vessels owned by the company are under long-term contracts to provide predictable revenue streams. The fleet continues to build its contract back log. Most recently, DLNG announced an extension for two of its vessels, Clean Energy and Arctic Aurora, that added $270 million to its contract backlog. This pushes the nearest contract maturity out until 2028.

Dynagas Earnings Presentation
The Distribution
The company has a somewhat checkered history, starting with eliminating the distribution to common unit holders in 2019. This was required as part of the terms of the $675 million credit facility that “restricts the Partnership from declaring or making any distributions to its common unit holders while borrowings are outstanding.”
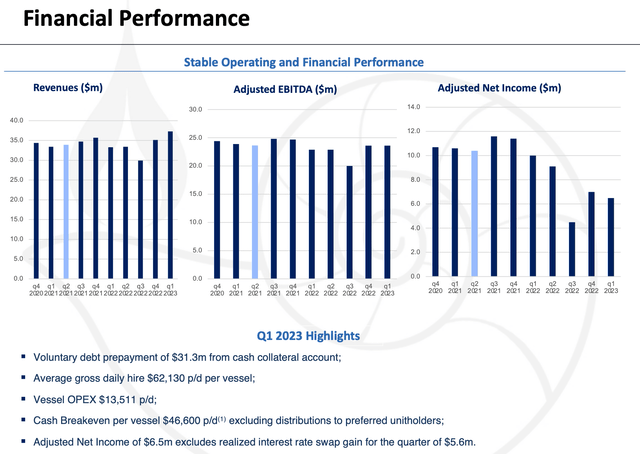
The company is permitted to continue to issue distributions to the series A and series B preferred units provided there is no event of default while the credit facility is outstanding. The series A units were issued at a 9% yield and a par value of $25/unit, but often trade at significantly lower values. This effectively boosts their yield into the 10% range. The company has maintained these payments since November 2015 and is in a solid enough financial condition to continue to do so – perhaps even more so than in the past. Starting in Q3, the vessel Arctic Aurora commences a three-year time charter that will pay out a significant premium to the fleet average. I’ll discuss the impacts of this new contract later.
Keep in mind that Dynagas is a publicly traded partnership. The partnership has elected to be taxed as a C-corp. The company issues a 1099-DIV for tax returns, not a K-1 similar to other partnerships.

Dynagas Earnings Presentation
The Difference Between Common and Preferred Units
For those who may not know the difference, I will address some of the key characteristics between a preferred and common share. From a simplistic view, preferred units are more of a hybrid between a stock and a bond. They still trade similarly to a common share but behave similar to a bond or interest collecting debt. As the name would indicate, the preferred units are a higher seniority to the common units and second to the company’s secured debt.
In this instance, Dynagas has issued two classes of preferred units, Series A and Series B. The series A (DLNG.PA) and series B (DLNG.PB) preferred units were issued at yield rates of 9% and 8.75%, respectively, with a par value of $25/unit.
From here, I will focus the discussion on the series A units. The series A units are a fixed rate distribution of $2.25 per unit on an annual basis and is paid out quarterly. The call date for these units was Aug. 12, 2020. This means the series A preferred units can be redeemed at any time by Dynagas, at a redemption price of $25 per unit. They will continue to pay out until redeemed by the company.
The Pattern and The Trade
If you are reading this, the 9% yield and the 30% return headline probably caught your eye. Well, I’m here to tell you that you’re going to have to work a bit to get that 30% return but what I am proposing is systematic with defined buy/sell criteria.
The first step will be to have an open mind and accept the fact that you actually won’t collect a distribution payment. This may seem crazy or foreign but hear me out.
The fundamental fact is that as a unit holder, you have what everyone else wants only four days a year. The other 361 days a year no one really wants what you own all that much. Those precious four days a year coincide with the quarter ex-dividend date.
In the figure below, you can see the price run ups that have occurred in 5 of the last 6 quarters. All of these occurred leading up to the ex-dividend date. The trade pattern follows the following criteria.
- Purchase units only below $22.75/unit. This low price level has been met or exceeded in three of the last four quarters. Q1 of 2023 was very close at $22.80/unit.
- Sell units only above $24.00/unit. This high price level has been met or exceeded within a week of the ex-dividend date for the last six quarters.
- If criteria 1 or 2 are not met, I sit and collect the distribution. I make some money and wait for the next quarter.

Seeking Alpha, Dynagas Press Releases
In the most recent run up, I sold 40% of my holdings in two sequences. The first at $24.55/unit and the second at $24.65/unit. My cost basis was roughly $22.50/unit. I did this for a few reasons.
- Dollars are dollars. I harvested almost an entire years’ worth of distributions in one transaction. It also works out to be over a 9% return in one quarter against the average ANNUAL return of 10.15% of the S&P 500 historically.
- Paying the tax man is OKAY. Being conservative, let’s say I can only execute this trade reliably at a 7.5% return per quarter. This works out to be a 30% return annually. On a $10,000 investment I would make $3,000 and pay roughly $900 in taxes on short term gains tax (30%). That same investment, sitting collecting yield, will get $900 in distributions and would endure $135 in taxes using long term gain tax rates (15%). Speaking for myself, I will pay $900 to make $3,000 every time. Note: Your personal tax rate is based on your own income levels and may be different than what I have projected.
- The main reason I like buy and hold is because once I sell a stock at a profit, I then have to find another way to scrape out my next profitable investment. This can also be described as fear of failure and fear of losing money. To combat this, we need to stick to the math we have done here and not let fear run our investments for us. I have increased my likelihood of success because this is highly repeatable and is based on other’s desire for yield and not my own.
The Fallback Plan
The obvious initial question to this type of plan would be what do I do if the price doesn’t rise to a level that meets our sell criteria? If this were to happen, that isn’t a bad thing. We just behave like everyone else and sit back collecting on the yield. If followed the criteria, our cost basis is below $22.75. This allows us to do nothing and still collect a yield that is pushing 10% while we patiently wait for our next opportunity next quarter.
If we execute the trade successfully only twice per year at a 7.5% profit, we have made 15% annually on short term capital gains. Adding in two distribution checks for that year boosts our return into the range of 20%. This is pretty good for a backup plan if you ask me.
Risks
There are two major risks to the thesis, both with varying degrees of consequence.
First, as already mentioned, the 30% return that I have projected could be threatened by a disruption in the repetitive price appreciation pattern associated with the ex-dividend date. This obviously would be disappointing and reduce our return to a very mundane 9%-10% range. In this scenario we would all live on to fight another day with a little bit of extra cash in our pocket.
The second and significantly more severe risk is Dynagas’s ability to continue to afford the distribution. Without this payment, our preferred units are worth hardly anything.
Dynagas’s largest vulnerability is their somewhat high debt levels and exposure to rising interest rates. Since 2019, the partnership has been paying down a $675 million credit facility at $12 million per quarter. The total balance now currently stands at $456.6million. Cash balances are approximately $52.9 million. This paydown agreement has allowed the company to slowly work down its balance while remaining cashflow positive and paying distributions to the series A and B preferred units. This credit facility contains a balloon payment in September of 2024 which ultimately will be refinanced.
The partnership has been able to manage the effective interest rate to around 3% using interest rate swaps. If the ability to do so is lost after the eventual refinancing, the partnership will see an increase in interest related expenses. The table below shows the potential quarterly impact of refinancing the projected $421 million that would remain on the credit facility. This assumes the refinance occurs at the beginning of 2024 and no additional prepayments occur.
| Interest Rate | 5.0% | 5.5% | 6.0% | 6.5% | 7.0% |
| Quarterly Interest | $5.26m | $5.8m | $6.3m | $6.8m | $7.3m |
Assuming a 6% interest rate follows refinancing of the credit facility, this will negatively impact FCF by roughly $3 million per quarter. This risk will be more than mitigated by a new time charter for Arctic Aurora that starts in Q3 of 2023. This vessel will fetch an average daily rate of $106,000. Assuming the previous fleet wide average rate of $67,683 per day per vessel, this new contract could contribute roughly $38,000 per day uplift to the company.
I therefore believe there is a high level of certainty that the partnership will be able to continue to pay the distribution.
Summary
This article was created to present a somewhat ‘off normal’ viewpoint in the search of higher returns. This does however, challenge investors to understand the fundamental value of the Series A preferred share and to operate somewhat outside of their comfort zone.
We have explored how to optimize an otherwise safe and boring investment to capture on the demand created by other investor’s desire for yield. This strategy could significantly increase returns, even after accounting for increased taxes that would be incurred. A fallback plan was also provided in the event the trading pattern does not develop due to outside market conditions.
Being a very small cap investment (market cap of approximately $100 million), the risks are higher than your standard blue-chip investment. To combat this, Dynagas has sufficient cash flow visibility and tail winds acting in its favor to mitigate potential risks to unit holders and the distribution.
Hopefully, this article challenged your thinking. I look forward to the comments. Happy investing.
Read the full article here


