(This article was co-produced with Hoya Capital Real Estate)
Introduction
I like to view my equity allocation in two parts. One being a set of Core funds like the SPDR S&P MidCap 400 ETF (MDY) that are index-based and cover an entire segment of the equity market. For the second part, I look for funds like the Invesco S&P MidCap Quality ETF (NYSEARCA:XMHQ) to add Alpha to my portfolio. Here I would split the allocation between index-based funds like XMHQ or if wanting a higher risk/reward scenario, one that is actively managed.
One place I look for funds is Seeking Alpha’s sub-class rankings, which is where I found XMHQ that will be reviewed in depth here.

seekingalpha.com/screeners/Mid-Cap-Blend-ETFs
Before I get started, there are some background details to present upfront.
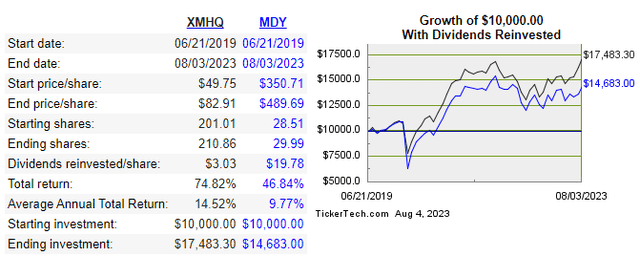
- On June 21, 2019, the index used became the S&P MidCap 400 Quality Index. This was the Invesco’s fourth change in indices for this ETF. The ETF was also renamed in 2019 from Invesco Russell Midcap Equal Weight ETF (EQWM). Any historical data I use later will start from 6/21/19.
- Since the index/investing change, XMHQ has outperformed MDY annually by over 450bps, with or w/o dividend reinvestment.
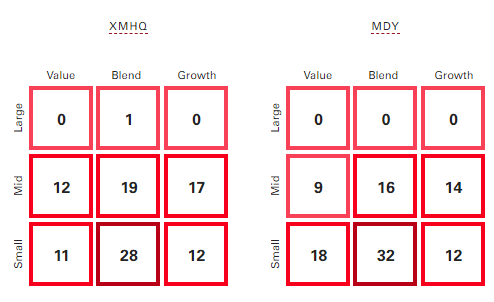
- Despite the name, the ETF holds a higher weighting in Small-Cap stocks than Mid-Cap ones. Normally these would eliminate the ETF from consideration but MDY shows a similar allocation. The point being market-cap designation is a fluid concept.
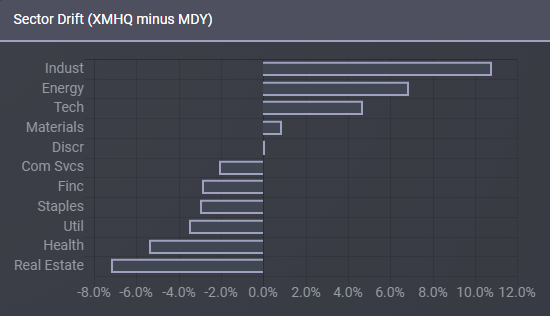
- The Quality screening used has affected the sector allocations to the degree that almost half vary by over 4%. This is analyzed later.
For those looking for an ETF that can add Alpha to their portfolio that invests in Mid/Small-Cap stocks, my analysis concurs what others see in XMHQ and it gets a Buy rating for their Quality strategy.
Understanding the Invesco S&P MidCap Quality ETF
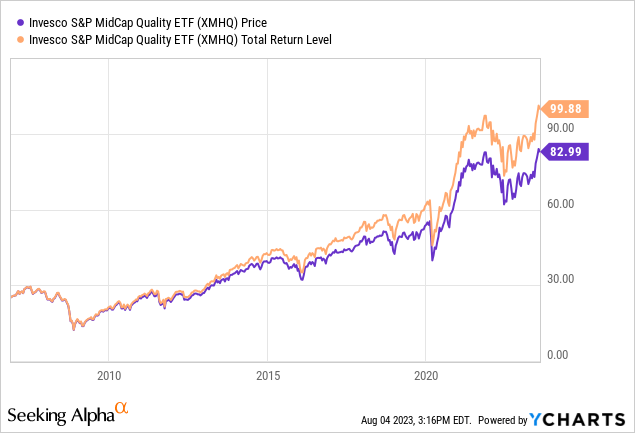
Seeking Alpha provides this description of the ETF:
The investment seeks to track the investment results (before fees and expenses) of the S&P MidCap 400® Quality Index, which is composed of a subset of securities from the S&P MidCap 400® Index. XMHQ started in 2006.
Source: seekingalpha.com XMHQ
XMHQ has $1.1b in AUM and costs investors 25bps in fees. With only a 1.14% yield, income investors need to look elsewhere.
The underlying S&P MidCap 400 Quality Index uses three factors to select and weight the 80 included stocks out of the wider 400 Index; those being accruals ratio, Return on Equity, and financial leverage. Each component is weighted based on combination of its assigned quality score and its float-adjusted market-cap.
Holdings review
I could not find an important data point for XMHQ, the turnover rate, which affects the ETF’s costs, and for a factor-based ETF, how dynamic the reweighting process is every June and December. To give some context instead, I compared sector weights and holding counts from now to last October.
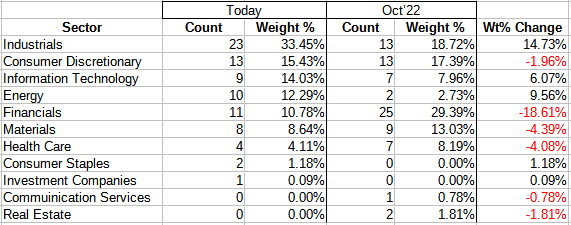
invesco.com; compiled by Author
As a proxy for turnover, I combined the absolute value of every sector weight movement since last October; that comes to over 60%. If that indeed accurately measures turnover, the negative is higher trading costs and potential that selling “winners” is index driven. On the plus side, it shows a very dynamic movement away from stocks that no longer qualify into ones that are of higher quality, which is the purpose of this ETF. As a reference point, the Mid-Cap 400 Index has a turnover rate near 18%.
Top holdings
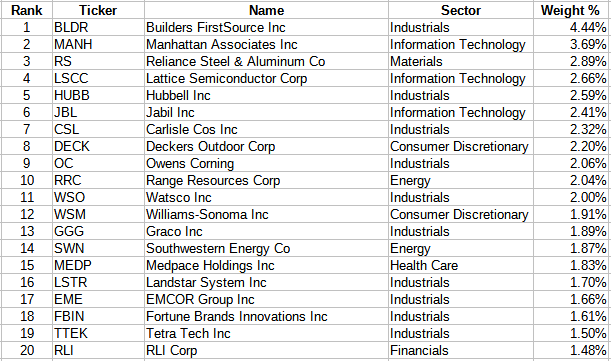
invesco.com; compiled by Author
XMHQ holds the expected 80 stocks it targets, with the above representing 45% of the portfolio, or about double what an equal-weighted portfolio would have. The smallest 20 stocks still represent 11% of the portfolio, meaning they still have the ability to impact performance. That is a benefit of the ETF holding so few stocks.
There are 11 stocks where the weight is over 2%, or almost 3X the largest weight of any stock held within the broader index. While this adds to the possibility of a “home run”, it also means the odds of a “strikeout” are greater.
For readers with the interest, this link shows how the stocks with the 2%+ allocation are currently evaluated/scored by Seeking alpha.
Distributions review

seekingalpha.com DVDs
So not only does XMHQ have a low yield, but it also varies each quarter and has recently been mostly in a downward trend. Seeking Alpha has given a “B” grade for this factor for XMHQ.
Performance review
While most readers might be familiar with the SPDR S&P MidCap 400 ETF, for others it is based on the premier Mid-Cap index maintained by S&P, like they do for Large-Caps (S&P 500 Index) and Small-Cap (S&P SmallCap 600 Index). By rule, every XMHQ holding must be part of the index used by MDY, thus my belief it is the best Mid-Cap ETF to compare XMHQ against.
If others are like me, they might own an ETF like MDY for their “Core” holding for this market segment and look at factored ETFs like XMHQ for possible Alpha. Using that concept, here is how those two ETFs compare.
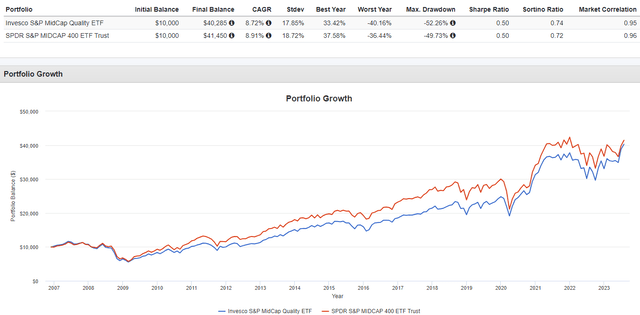
PortfolioVisualizer.com
Looking at the above chart, which dates back to 2004, a “why bother” response seems appropriate, but remember that XMHQ changed its index on 6/21/2019. Using another source, I can get a more precise data for the return’s comparison.
dividendchannel.com
This demonstrates the importance of what the index can mean to an ETF. Since moving to a Quality-focused strategy, XMHQ is ahead by almost 500bps annually. Also note how much income XMHQ holders gave up compared to MDY investors. Since XMHQ started, MDY holders have received $16.75/share more to reinvest back into their investment, which drastically reduces the gap between the price movements of the two ETFs.
Portfolio strategy
Here I decided to take a narrow view of this topic and start with the assumption that our investor already decided to expand their Mid-Cap exposure and wants to either add XMHQ or expand their MDY holdings. If this was me, I would be comparing the following to understand how these ETFs differ. First, does the Quality focus effect the market-cap and/or Growth/Value allocations?
advisors.vanguard.com compare
We see that XMHQ has about 9% more Mid-Cap weight than MDY and only a slight shift to Growth stocks; both of which seem minor to me. From my viewpoint, any sector differences would play a larger role in producing different return outcomes.
ETFRC.com
Five of the eleven sectors differ by over 4%; one of the most I have seen when comparing two ETF in the same market-cap realm. The two biggest overweights compared to MDY has the XMHQ strategy dependent on the US economy staying out of a recession. Looking at individual positions, XMHQ is within .7% of the same stock in MDY underweight wise, but XMHQ’s two biggest positions are both more than 3% overweighted compared to MDY’s allocation to them. As described by Seeking Alpha, they are:
Builders FirstSource (BLDR) which “manufactures and supplies building materials, manufactured components, and construction services to professional homebuilders, sub-contractors, remodelers, and consumers in the United States. While both SA Analysis and Wall Street rate BLDR as a Buy, it rates even higher amongst the XMHQ rankings.”
Manhattan Associates (MANH) “serves retail, consumer goods, food and grocery, logistics service providers, industrial and wholesale, high technology and electronics, life sciences, and government industries. MANH offers Manhattan SCALE, a portfolio of logistics execution solutions that provide trading partner management, yard management, optimization, warehouse management, and transportation execution services; and Manhattan Active, a set of enterprise and omnichannel solution, which include enterprise solutions and omnichannel solutions for store.” MANH rates a Buy from Wall Street, only a Hold from the SA Analysts.
Final thoughts
With the appreciation of the risk caveats listed above and with only four years of history under the latest index used by XMHQ, I am comfortable giving this ETF a Buy rating, the same as the Seeking Alpha Quants and another Seeking Alpha contributor did last April. The near 50% weighting in the top two sectors definitely adds risk but as was seen, the semi-annual rebalancing has shown large reallocations can occur which, if timed right, should control the risks sector allocations bring to the table. With Invesco history of changing ETF underlying indices (8 this past June, 9 others in 2019), anyone holding an Invesco ETF needs to keep their eyes open.
I mentioned several times, own XMHQ for the Alpha. To answer if that is happening, I looked at what Portfolio Visualizer shows since the index change for XMHQ: They have XMHA at +211bps compared to a -292bps for MDY and that was achieved with a lower Beta and StdDev!
For investors looking for a Mid-Cap Growth ETF for possible Alpha, I recently reviewed #3 in that sub-class: XMMO: Momentum Strategy Working For Mid-Cap Stocks
My fellow Hoya Capital Income Builder contributor, The Sunday Investor, just penned SCHM: Schwab’s Mid-Cap Blend ETF Not Worth Buying, which briefly compares the XMHQ ETF to another Mid-Cap index: worth the read.
Read the full article here


