Monetary policy is perhaps the main reason why foreign equities have the reputation of being somewhat unloved by U.S. investors. The gist is that it is necessary to not only identify long plays based on their individual merits but also factor in an FX ingredient to understand whether the thesis makes any sense at all if adjusted for currency fluctuations. This becomes especially vivid when looking at hedged and unhedged ETFs. Yet this obviously does not postulate that non-U.S. stocks should always be ignored. There are periods when there is more alacrity in overseas markets than in the U.S., and the monetary policy changes might offer opportunities as well. That is why I frequently monitor the international ETF universe for candidates worthy of discussion. And the Cambria Foreign Shareholder Yield ETF (BATS:FYLD) is yet another developed world-focused fund I would like to assess today. As a reminder, the previous one was the ALPS International Sector Dividend Dogs ETF (IDOG) just a few days ago.
While elegant simplicity was the case with IDOG, FYLD’s active strategy goes much further than dividend yield chasing, instead relying on a broader concept of shareholder yield in its pursuit of cash-rich, reasonably priced, and fundamentally sound developed-world companies, ignoring the U.S.
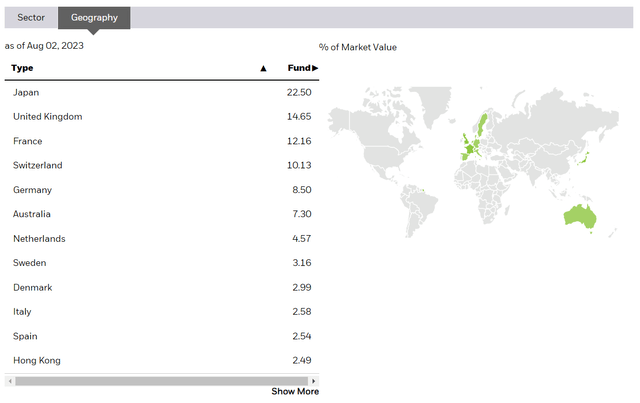
In short, the factors commingled in the strategy are quality and value taken in specific interpretations. According to the summary prospectus, the initial universe is “developed ex-US, publicly listed companies,” with 23 countries from Australia to the United Kingdom being eligible. Canada is also on the list, so please take notice that exposures inside the FYLD portfolio might significantly differ from those within the iShares MSCI EAFE ETF (EFA), which has no footprint in this North American nation’s equities, instead being more dependent on Japan and, obviously, on the JPY and the BoJ’s view on monetary policy.
EFA website
Exposure to Canada (close to 16% as of August 2) should not go unnoticed by investors who would like to have a better understanding of what performance FYLD might deliver. The issue here is that the CAD would inevitably add a bit more oil price-related volatility to the strategy as the currency is partly dependent on petroleum market dynamics. To corroborate, let me quote the Bank of Canada:
Canada is a key producer of oil, minerals and other raw materials. Our economy depends more on resource exports than many other advanced economies do… If the price of raw materials falls, our currency tends to drift downward.
Other countries in the main trio to watch closely are Japan (18.4%) and the UK (15.8%). Resource-rich Australia, which is in 4th place with an around 7% allocation, would also add a bit more iron ore demand-related volatility via the Australian dollar. Among the countries that have the smallest impact on FYLD’s total returns in the current version are Finland, Switzerland, and New Zealand, with weights of 94 bps, 86 bps, and 75 bps, respectively.
Another issue to pay attention to is that FYLD is not immune to hidden EM exposures via its Hong Kong investments, precisely like in IDOG’s case, which I have discussed recently. A nice example to present is HK-headquartered China Resources Cement Holdings Limited (HK ticker 1313) (OTCPK:CARCY), which describes itself as “a large-scale and competitive cement, clinker and concrete producer in Southern China.” So these plays add some EM-specific risks to the mix.
The shareholder yield is “the totality of returns realized by an investor from a company’s cash payments for dividends, buybacks and debt paydowns.” However, delving into the initial universe, Cambria first applies the sum of net buybacks and dividends to whittle it down to just 20% of the worthiest. Debt paydowns are factored in only on the next step, with value metrics (like EV/EBITDA and P/FCF) added to form the final group of 100 names, which are weighted equally.
Besides, it is important to understand that FYLD switched from a passive approach to an active one a few years ago. Let me quote page 6 of the prospectus:
The Fund’s investment objective and strategies changed effective June 1, 2020. Prior to that date, Fund performance reflects the investment objective of the Fund when it sought investment results that corresponded (before fees and expenses) generally to the price and yield performance of the Cambria Foreign Shareholder Yield Index.
The product of the strategy is a portfolio of 100 holdings, with the top ten accounting for 14.4% as of August 2 (excluding cash, which had a 2.2% weight). As FYLD overweights stocks with higher shareholder yields, small wonder its sector mix is dominated by generally less expensive, cyclical sectors. The fact sheet as of June 30 shows the fund was overweight materials (21.7%), financials (20.5%), and industrials (19.1%). Energy (15.7%) was in 4th place.
Calgary-based Imperial Oil (IMO) is the key representative of the sector as well as FYLD’s top holding with a 1.7% weight. IMO, which is majority-owned by Exxon Mobil (XOM), is one of the most notable global unconventional players, generating a solid share of its petroleum revenues from Canada’s oil sands, though its business stretches a long way beyond unconventionals, with downstream and chemical operations also solidly contributing to the top line. IMO was hit hard by the coronavirus-related oil price crisis in 2020. However, as the supply/demand imbalances sent petroleum prices much higher, it has been using FCF to consistently repurchase stock. As mentioned in the Q2 2023 press release, IMO has:
…Renewed share repurchase program, enabling the purchase of up to five percent of common shares outstanding, a maximum of 29,207,635 shares, during the 12-month period ending June 28, 2024.
The program is supposed to be completed this year. It is worth quoting CEO Brad Corson from the Q2 earnings call:
… we have decided to accelerate the buyback program with the intention of having it completed prior to the end of this year.
Also, IMO is fairly inexpensive; for instance, it is trading at 4.77x EV/EBITDA compared to Chevron’s (CVX) approximately 6x. A similar story is told by the EV/Production ratio, which stands at around 89.6x vs. CVX’s 104x (as per my calculations).
FYLD has an ex-U.S. ETF problem
FYLD is benchmarked against the MSCI EAFE index. However, as there is no Canada in the EAFE group, I suppose a fairer comparison would be the MSCI WORLD ex USA IMI Index, which is tracked by the iShares Core MSCI International Developed Markets ETF (IDEV). Another fund worth comparing its returns to is the Vanguard FTSE Developed Markets ETF (VEA), which tracks the FTSE Developed All Cap ex US Index. The iShares Core S&P 500 ETF (IVV) is also worth adding. I decided to analyze the period since FYLD’s inception as the key principles of its index-based strategy were mostly similar to those of the current active strategy.
The first period is January 2014 – July 2023. Here, FYLD looks bleak, with the weakest annualized total return.
| Portfolio | FYLD | IVV | VEA |
| Initial Balance | $10,000 | $10,000 | $10,000 |
| Final Balance | $14,947 | $29,651 | $15,156 |
| CAGR | 4.28% | 12.01% | 4.43% |
| Stdev | 17.25% | 15.07% | 15.39% |
| Best Year | 29.81% | 31.25% | 26.42% |
| Worst Year | -14.51% | -18.16% | -15.36% |
| Max. Drawdown | -34.40% | -23.93% | -28.08% |
| Sharpe Ratio | 0.27 | 0.76 | 0.29 |
| Sortino Ratio | 0.38 | 1.17 | 0.42 |
| Market Correlation | 0.82 | 1 | 0.88 |
Created using data from Portfolio Visualizer
The second period is April 2017 – July 2023 (IDEV was incepted in March 2017). Though it was still unable to outcompete IVV, it managed to beat the simpler developed-world plays like IDEV and VEA as its value-focused approach allowed it to weather the 2022 bear market much easier, with just a 5.5% decline, while other ETFs were down in the double digits.
| Portfolio | FYLD | IVV | IDEV | VEA |
| Initial Balance | $10,000 | $10,000 | $10,000 | $10,000 |
| Final Balance | $15,330 | $21,697 | $14,670 | $14,597 |
| CAGR | 6.98% | 13.01% | 6.24% | 6.15% |
| Stdev | 19.27% | 16.99% | 16.66% | 16.94% |
| Best Year | 19.80% | 31.25% | 23.11% | 22.62% |
| Worst Year | -14.51% | -18.16% | -14.96% | -15.36% |
| Max. Drawdown | -34.40% | -23.93% | -27.49% | -28.08% |
| Sharpe Ratio | 0.37 | 0.72 | 0.35 | 0.35 |
| Sortino Ratio | 0.52 | 1.08 | 0.51 | 0.5 |
| Market Correlation | 0.83 | 1 | 0.9 | 0.9 |
Created using data from Portfolio Visualizer
Investor Takeaway
Utilizing the concept of shareholder yield (modified with the addition of debt paydowns, which makes sense), FYLD captures the top-quality corner of the developed-world equity spectrum, excluding the U.S. This is an admittedly potent cash-centered approach. And it is tough to argue against investing in such a promising vehicle, especially assuming it is trading with a rock-bottom P/E of about 6.77x (according to the data from Portfolio Visualizer) and a massive dividend yield of 6.9%.
However, the flip side here is that its excess returns are either minimal (if compared to developed-world baskets) or non-existent (if compared to the U.S. 500 bellwether index). The expense ratio is also not particularly comfortable at 59 bps, yet it is still justified for a complicated international active value strategy. Overall, despite the concept being perfectly calibrated, I would opt for a more skeptical stance, assigning a Hold rating to FYLD.
Read the full article here


