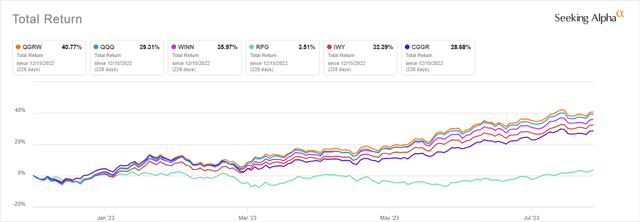
WisdomTree U.S. Quality Growth Fund (NYSEARCA:QGRW) is a U.S. growth equity ETF with a quality ingredient debuted in December 2022. The timing of the launch appeared to be extremely opportune as the growth rotation was in its nascent stages. That is to say, a 40.8% total return since its inception (15 December 2022) is indubitably solid, but it has been mostly the function of market ebullience and the AI narrative, with the question being whether momentum will last or sputter. With the final interest rate hike likely on the horizon, investors might consider boosting their growth allocations expecting the rally to last well into 2024. Interestingly, the Q2 earnings season remains supportive for growth style enthusiasts for now as some softness after disappointing Netflix (NFLX) and Tesla (TSLA) releases has been shrugged off, with the Invesco QQQ ETF (QQQ) up about 3.4% for the month.
However, regardless of whether the growth stocks will march higher or not, I would like to highlight a few vulnerabilities of this vehicle to allow investors to understand whether QGRW is apt for a long-term portfolio or is just a short-term speculative play.
According to its website, the idea at the crux of the market-cap-weighted WisdomTree U.S. Quality Growth Index, which QGRW is supposed to track, is to amalgamate the growth and quality factors in a 100 strong portfolio of predominantly large-cap U.S. names. To achieve that, the 500 U.S. companies ranked by market cap face growth and quality tests. For the growth part of the equation, a median analyst earnings growth forecast, 5-year EBITDA growth, as well as trailing 5-year sales growth are mixed in a 50%/25%/25% proportion. Quality is measured using the “trailing 3-year average return on equity and trailing 3-year average return on assets” which are weighted equally. I would recommend reading the prospectus and the index methodology for a better understanding of the process.
As I said above, QGRW has delivered fairly outstanding gains since its inception, not simply clobbering the market proxied with the iShares Core S&P 500 ETF (IVV), which has risen by only 18.6%, but also outmaneuvering QQQ, something that other growth-oriented vehicles utilizing sophisticated screens frequently fail to achieve. For comparison purposes, I have selected the following group of ETFs I covered in the past:
- iShares Russell 1000 Growth ETF (IWF),
- Invesco S&P 500 Pure Growth ETF (RPG),
- iShares Russell Top 200 Growth ETF (IWY),
- Harbor Long-Term Growers ETF (WINN),
- Capital Group Growth ETF (CGGR).
Seeking Alpha
QGRW has beaten all of them.
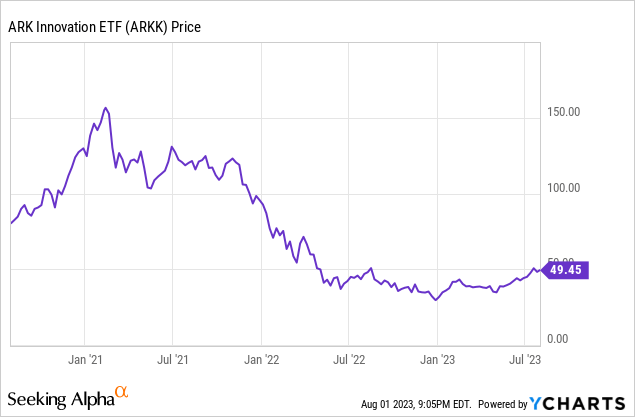
So, assuming the extraordinarily supportive background marked by abating inflation, the result is obviously robust. However, in my research, I certainly go well beyond momentum, as momentum only-guided decisions could produce not only spectacular but also harrowing results if timed wrong. The ARK Innovation ETF (ARKK) February 2021 case is an excellent reminder.

Looking under the hood, it is fairly expectable that investors are not getting much in terms of earnings yield exposure, and the vehicle is of course not designed to provide one. To reiterate, this is a play betting on companies that already have a growth track record, are forecast to continue growing in the near future, excluding those that are underachieving on the capital efficiency front.
So, my calculations based on the data as of July 30 showed its weighted-average EY at just 2.79%, a minuscule level even by the growth echelon standards. For clarity, its two major holdings as of that date were Apple (AAPL) and Microsoft (MSFT), together accounting for about 23.6%, which seems a little bit out of proportion for a portfolio of 100 names. And their EYs are obviously just modest, at ~3% and ~2.9%, respectively.
For a broader context, about 44% of QGRW’s net assets are allocated to stocks that have an EY even below the WA and just marginally above zero. Nevertheless, that figure might be distorted by earnings volatility, which is inherent in rapidly growing names because of their massive R&D outlays necessary to sustain competitive advantages. Alas, EV/EBITDA, which should provide a more reliable result, also offers no solace as it is even lower, standing at 2.6%, revealing that QGRW’s holdings are actively using borrowed funds in their growth pursuits, even though this is not entirely evident from the Market Cap/Enterprise Value spread of ~$10.7 billion (indicating that portfolio-wise, EV is even lower than the market cap). Oddly enough, the 4.1% net CFFO yield is not as depressed, with solid contributions made by cash-rich Coterra Energy (CTRA), Steel Dynamics (STLD), Builders FirstSource (BLDR), and CF Industries Holdings (CF) that have converted more than a fifth of their market values into the net CFFO.
For an even better context, the WA Price/Sales ratio of 10.6x is an another sign of QGRW’s valuation problem. And finally, it is of note that the fund is betting on the priciest stocks in their sectors as most (over 93%) had a Quant Valuation grade of D+ or worse as of July 30.
But what are investors paying for? For a forward revenue growth rate of ~12.1% and EPS growth rate slightly below 12%. It is worth clarifying here that the weighted-average figure masks a few EPS contraction stories. Analysts are pessimistic on ~10% of the holdings anticipating their EPS to decline going forward. However, robust growth stories should also not go unnoticed as over 18% have EPS growth rates above 20%, including Insulet’s (PODD) ~104% and Super Micro Computer’s (SMCI) over 80%. As to the top line, just 3.2% are forecast to see their revenues declining; at the same time, growth champions like CrowdStrike (CRWD), Datadog (DDOG), Enphase Energy (ENPH), TSLA, etc. also contribute to the weighted-average rate.
| Company | Weight | Sector | EY | Revenue FWD |
| CrowdStrike (CRWD) | 0.35% | IT | -0.41% | 38.96% |
| Datadog (DDOG) | 0.32% | IT | -0.23% | 37.26% |
| Enphase Energy (ENPH) | 0.20% | IT | 2.73% | 33.98% |
| Tesla (TSLA) | 4.48% | Consumer Discretionary | 1.44% | 33.64% |
| Super Micro Computer (SMCI) | 0.17% | IT | 3.34% | 33.51% |
| Take-Two Interactive Software (TTWO) | 0.24% | Communication | -4.37% | 33.20% |
| Arista Networks (ANET) | 0.44% | IT | 3.26% | 27.86% |
| NVIDIA (NVDA) | 5.82% | IT | 0.41% | 27.80% |
| Axon Enterprise (AXON) | 0.13% | Industrials | 1.02% | 26.26% |
| Seagen (SGEN) | 0.33% | Health Care | -1.80% | 26.24% |
Created using data from Seeking Alpha and the fund
The ultimate question is about whether QGRW is delivering on the quality front. First, from the Quant perspective, it is already crystal clear that the portfolio has top-quality names as just 1.2% of the companies have a C (or C-) Profitability grade; the rest of the holdings are a B- rated or higher. Second, my calculations show its WA Return on Equity at above 50%. This is a spectacular result, but caution is drastically needed here as a few abnormally high ROE names (owing to their burdensome borrowings and minuscule shareholder equity as a consequence) are the key contributors, especially Fortinet (FTNT) with its ~790% ROE. Nevertheless, we still see ROA at ~14.9%, which is an unquestionably healthy result.
Investor Takeaway
QGRW offers a fresh look at long-duration equity investing by adding capital efficiency screening. The 28 bps expense ratio is adequate. With just 7 full months in the books, it has only $52 million in AUM.
Market-cap weighting makes its sector mix somewhat similar to QQQ’s, with IT (33.8%) and consumer discretionary (15.6%) being the top two. To some extent, QGRW is also an AI play, owing to this developing industry’s key beneficiaries like NVDA being represented (close to 5% weight as of July 30).
The growth/quality duo is a combination I like, perhaps even more than a quality/value factor synthesis in the current environment. I would like not to sound permabearish, but the problem here is that while the results are already encouraging, it would be hasty to extrapolate these returns as there is a solid deal of market ebullience in this performance story, which means it is unknown how the ETF might perform without such a backdrop or in tighter conditions like those we saw in 2022. Also, we do not know much about its drawdowns or an annualized standard deviation as the period is, again, simply too short. Nevertheless, I appreciate QGRW’s quality, which is nothing short of strong as the analysis above illustrates. So the mix delivered is worthy of attention, but I am still tilting toward a more neutral view today.
Read the full article here


