Investment Thesis
I have identified Cisco Systems (NASDAQ:CSCO) as a technically attractive stock that provides an attractive dividend with a low payout ratio while providing a space for healthy growth of revenues and maintaining strong fundamentals. It seems to be also undervalued according to the regression models of selected valuation multiples.
Tailwinds and Headwinds
Cisco has an attractive dividend (forward yield 2.96%) and a healthy payout ratio of 43%, which makes it attractive to income investors. Cisco continues as well to buy back its stock on a regular basis. In Q3, Cisco returned $2.9 billion to shareholders, which was comprised of $1.6 billion payout for the quarterly cash dividend and $1.3 billion of share repurchases. Cisco ended the quarter with $12.2 billion in remaining stock purchase authorization. These rewards for the shareholder are achieved thanks to the incredible cash-generating capabilities of Cisco which, combined with a strong balance sheet and low debt, provide a stalwart foundation for conservative investors, while still looking at a tech stock.
Cisco achieved in Q3 2023 strong results with double-digit growth of revenue, reaching record revenue ($14.6B, of which product revenue was $11.1 billion, up 17%, and service revenue was $3.5 billion, up 3%) and record operating cash flow generation of $5.2B, up 43% YoY – caveated by the deferral of the Q3 federal tax payment pushed until Q1 of FY 2024. Cisco’s total gross margin stays at 65-ish%. The strongest growth of 29% has been recorded for the Secure Agile Networks product category, which is responsible for nearly half of Cisco’s revenues. The only segment that was down was Collaboration (collaboration devices and meetings solutions).
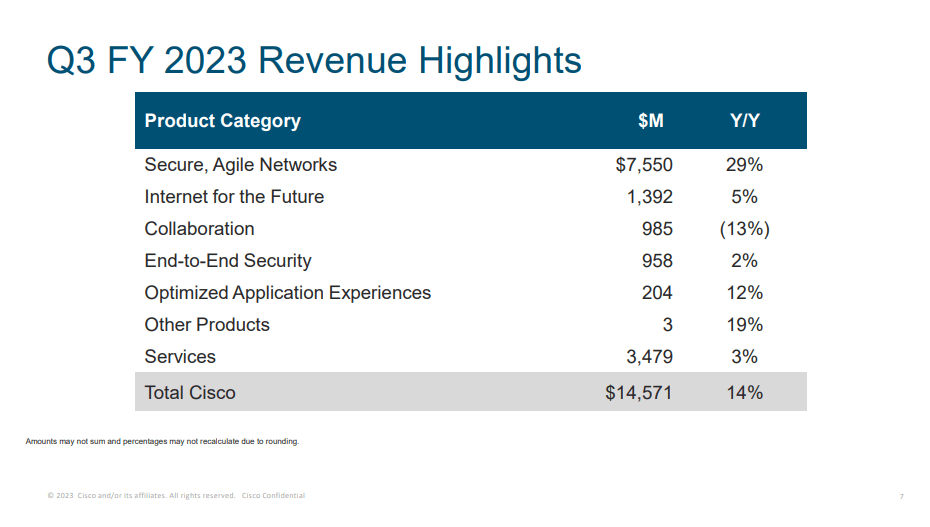
Q3 FY 2023 Revenue Highlights (Cisco Systems, Inc. 2023 Q3 – Results – Earnings Call Presentation)
Backlogs declined thanks to improved supply and accelerated shipments, a positive situation for which many businesses have been waiting after the gehenna of the COVID supply problems.
Following the strong result of Q3, the management raised FY 2023 outlook for revenue and EPS but expects lower revenue growth for FY 2024. What is worthwhile noticing is that for the last 2 years, margins have expanded and Cisco has grown EPS at a higher rate than revenues thanks to strong expense controls.
Besides organic growth and reinvestments, Cisco closed the acquisition of Valtix and intents to acquire two other companies to build capabilities in cloud, security, and full-stack observability. Cisco entered the AI business with the production of its own chips with a focus on the network infrastructure for AI, ML, and IoT.
I appreciate the response of Chuck Robbins with regard to the long-term trends ahead of the sector and how it will play into Cisco’s hands:
[…] technology trends and what our customers are focused on, the good news for us is that […] every customer on the planet basically has five key priorities that we actually align to. One is they’re re-architecting for this multi-cloud world. They’re trying to figure out hybrid work. They’re rebuilding their entire application strategy and re-architecting their applications. They’re rebuilding their cyber footprint because of all this distributed nature of what they’re doing now, and they’re focused on sustainability. And our technology plays across all of those very important areas
As for headwinds, the large size is advantageous for Cisco for capitalizing on economies of scale, but it may also weigh down the business, making its models less flexible and unable to react to rapid changes. Cisco has a competitor in practically every segment in which it operates since most of these segments have minimal entry barriers. Many analysts say as well that entering AI capabilities is not a competitive advantage for Cisco because all others can do it as well. I think that it is perhaps time to stop saying that AI is an advantage for any business any longer and simply accept it as a necessity verging on a commodity.
Predicting Multiples from Regression Models
The analysis uses the January 2023 regression models provided by Professor Aswath Damodaran on his site. The models are calculated each January for the key global markets, with the US market as a separate one.
According to this approach, a company’s current trading multiples are compared to the same company’s predicted multiples based on regressions calculated from the state of the whole market in which it operates. Therefore, we are not seeking to draw conclusions from comparing the current trading multiples between a company in question and its sector peers or other companies with similar risk, growth, and cash flow (which is professor Aswath Damodaran’s definition of the “comparable” firms). Instead, we are looking for the relative difference in the form of the ratio between the current value and predicted value (i.e. difference of current minus predicted, divided by predicted). As a result, a company that trades currently in the market at a multiple lower (higher) than the one predicted from the market regressions based on the aggregate market data of all the companies in this market, is undervalued (overvalued). If we compare two companies and more, the one which has the biggest negative ratio is the most undervalued, while the one that has the biggest positive ratio is the most overvalued by the market. If you want to read more about this approach, check my article on Adobe, where I present in more detail the regression equations and explain how I use them.
The multiples I will analyze here are for Price-Earnings to Growth (PEG), Price to Book Value (PBV), Enterprise Value to Invested Capital (EV/IC), Enterprise Value to Sales (EV/Sales), and Price to Earnings (P/E). In the tables below they are presented in the descending order of a statistical value of R-squared, that is to say, by their explanatory power. I am skipping EV to EBITDA multiple due to its insignificant R-squared.
Is Cisco relatively under- or overvalued?
To perform this analysis, I collected the inputs for the fundamental values of Cisco. Find them in the tables below. A modification I made is using an analyst’s consensus growth rate prediction of EPS for the next 3-5 years in place of the prediction of Sales growth due to the uncertain availability of information for the latter in a consistent manner. This replacement is allowed in Damodaran’s model. I have changed the source of the EPS forward growth rate (as CAGR) prediction numbers from Finviz to Seeking Alpha, now for Cisco and for all companies in future articles.
|
Inputs |
Values for CSCO July 24, 2023 |
Source |
|
Payout ratio or “1- g/ROE” |
0.4286 |
Seeking Alpha |
|
gEPS – 3-5 years CAGR forward growth prediction by analysts/ to use also as a proxy for g of Sales on EV/IC |
0.0542 |
EPS FWD Long Term Growth (3-5Y CAGR), Seeking Alpha |
|
LN of gEPS for the PEG calculation |
-2.915 |
own calculation |
|
B – beta of company |
0.8 |
Seeking Alpha |
|
ROE = NI/ BV Equity TTM |
0.2774 |
Seeking Alpha |
|
ROIC – Return on invested capital = ROC = EBIT (1-t) / (BV of Debt + BV of Equity-Cash) TTM |
0.2223 |
Morningstar |
|
DFR = Debt to capital ratio = Total Debt/(Total Debt + Market value of equity) Q3 2023 |
0.0424 |
own calculation, data from Seeking Alpha (in $ B: Market Cap: 214.47; Total Debt Q3 2023: 9.493) |
|
Tax rate = Effective tax rate = Taxes paid/ Taxable Income: FY 2023 guidance assumes an effective tax provision rate of 20% for GAAP |
0.20 |
Q3 2023 Earnings report |
|
Operating Margin = Pre-tax Operating Income/ Sales TTM |
0.2650 |
as EBIT margin, Seeking Alpha |
If we apply these financial data to the regression equations provided by Damodaran, we receive the predicted values of the multiples. See the results below.
|
Regression equations for year 2022 |
R-squared |
Predicted multiples |
|
EV/Invested Capital= 3.53 + 1.30 g + 7.30 ROIC – 4.20 DFR |
0.567 |
5.045 |
|
PEG = 6.71 + 1.20 Payout – 1.57 ln(gEPS) -0.77 Beta |
0.566 |
11.185 |
|
PBV= 2.32 + 4.60 gEPS – 1.33 Beta + 8.90 ROE + 0.80 Payout Ratio |
0.369 |
4.317 |
|
EV/Sales = 2.32 + 2.60 g + 10.60 Oper Margin -1.40 DFR- 3.50 Tax rate |
0.306 |
4.511 |
|
PE = 8.63 + 2.23 Beta + 46.20 gEPS + 19.30 Payout |
0.25 |
21.179 |
We can compare now the predicted values of multiples to the values that are actual and based on stock price and raw financial data as of the day of writing. As I mentioned above, the comparison of the predicted vs actual values indicates the theoretical over- or undervaluation in the context of the aggregate data of all companies in the US market.
|
Multiple |
Predicted multiples |
Currently trading at |
Source of current multiple |
Undervalued or overvalued by the US market values |
|
EV/IC |
5.045 |
n/a |
own calculation |
n/a |
|
PEG |
11.185 |
2.55 |
Seeking Alpha, forward PEG (forward Non-GAAP PE Ratio divided by EPS long-term growth consensus estimate for 3 to 5 year CAGR) |
-77.20% |
|
PBV |
4.317 |
5.07 |
Seeking Alpha |
17.44% |
|
EV/Sales |
4.511 |
3.66 |
Seeking Alpha |
-18.86% |
|
P/E |
21.179 |
18.87 |
Seeking Alpha |
-10.90% |
Based on the ratios between current valuation multiples and regressions we can appreciate the scale of differences and try to establish a predominant inefficiency of the market. If we follow the theory of regressions, we can say that Cisco trades currently at a forward PEG which could be considered expensive (forward PEG 2.55) according to the popular interpretation of this multiple. However, in comparison to the regression-based PEG, it seems that Cisco is relatively undervalued, missing 77% of the predicted PEG value of 11.18. Given a modest consensus CAGR of EPS for the next 3-5 years (as for the “G” in the denominator), it could be inferred that the P/E multiple should expand and this could happen if the price (P) rises more than the earnings (E). As a conclusion, we could understand that if the current PEG already indicates overvaluation, and the regression indicates an even bigger overvaluation, the current valuation is relatively low and indicates “cheapness”, no matter how irrational this could sound. Interested investors should pay attention to the discussion in the earnings call for Q3, where it is admitted that while Cisco grows EPS at a higher rate than revenue, the revenue growth should be considered in the range of 2-3% (“back of the envelope” calculations). The management is well aware of the exceptional performance for 2023, which was compared to the double-digit revenue growth for a full-year back in 2012 in the bounce back from the global financial crisis. Thus, not so easily replicable if we are to be back to business as, more or less, usual.
Cisco’s current P/E is slightly undervalued in comparison to the predicted P/E, missing nearly 11% of the predicted value. By the EV/Sales, Cisco is more undervalued – missing a chunk of nearly 19% of its “fair” EV/Sales. This could be explained by a very low debt-to-capital (DFR) ratio which is a part of regression for EV/Sales. On the topic of multiples based on balance sheet data, that is to say, PBV, Cisco is overvalued by 17.44%.
Overall, the comparison of the values predicted by the regression and the current multiples indicates that Cisco is undervalued by today’s market and the stock should trade at higher multiples.
The current value of EV/IC is not readily available in public and free sources, so I only calculate it on the basis of the regression equation for the reason of its highest statistical explanatory value (from all the equations presented by Damodaran). It may be used by the reader to compare separately the companies analyzed in my individual articles amongst themselves.
Technical analysis
I will analyze Cisco from a perspective of a number of technical analysis tools and show the screenshots on the monthly and weekly Heikin-Ashi candles charts – each timeframe presented through two separate sets of indicators which I bundled in views called Chart 1 and Chart 2. Those two timeframes will be complemented with a simplified daily Renko chart to reflect the price momentum. The details of my methodology can be found in my previous articles as those on Salesforce or Adobe.
For long-term trend analysis, I use monthly charts. In Chart 1 setup, Cisco stock has started July with a strong green Heikin-Ashi candle, already above all the Alligator’s lines which all are in a positive setup (Lips green line over Teeth red line and Teeth over Jaw blue line) and pointing upwards. Ichimoku Cloud has established a strong S/R level around $48.50, with its very long lower edge. To the far right, we see that the green cloud started rising. We also see a steady rise in the On Balance Volume (OBV) line ever since the low in October 0222. The Awesome Oscillator (AO) has marked the second green bar above the zero level, giving signs of converging with other indicators. The bottom pane is indicating Revenues.
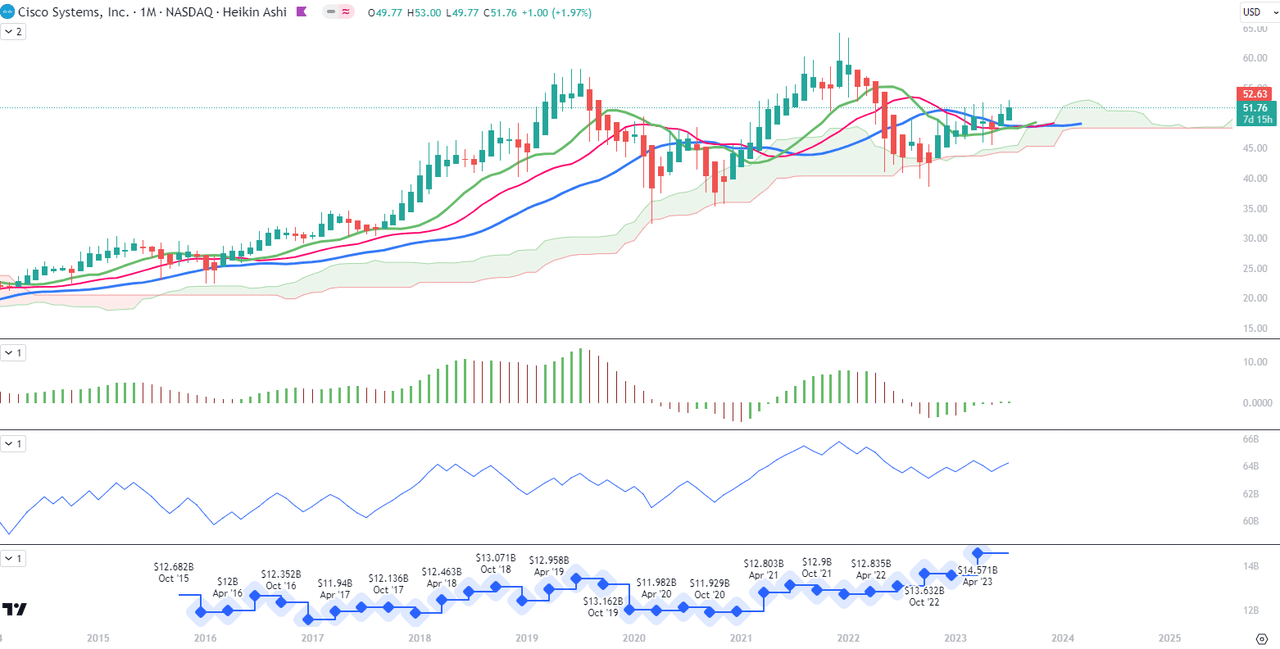
Chart 1 – Monthly (TradingView)
In Chart 2 setup, the 10-month Moving Average is now on the verge of crossing above the 50-month MA. The Composite Index Divergence Indicator (CIDI) is above both fast (green) and slow (orange) moving averages, and the fast one is approaching the slow one from below. Moving Average Convergence Divergence (MACD) has crossed its signal from below and is now above the zero level. MACD signal is on the verge of crossing the zero level as well. Combined with the Positive Direction Indicator (DI+) line moving slightly above the Negative Direction Indicator (DI-), we can see positive indications of an approaching uptrend.
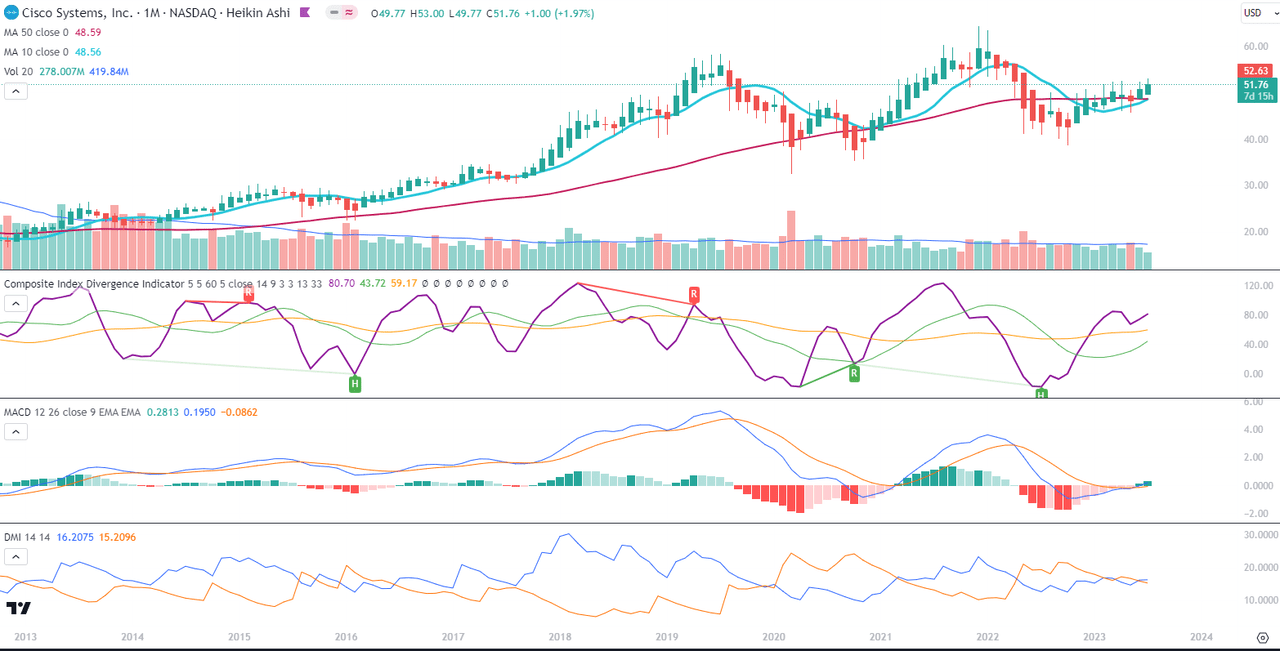
Chart 2 – Monthly (TradingView)
For the mid-term trend analysis, I use weekly charts. In Chart 1, I have drawn a higher S/R line to reflect the long upper edge of the past Ichimoku red cloud. The cloud is now green but this S/R on the level of $52.50 could be the level of testing and breakout. Alligator’s lines are all trending upwards. AO is above the zero level, trending slightly downwards, though. The correction on the AO bars may indicate a short-term loss of momentum and a price correction in the coming weeks. The OBV line is rising and reaches the levels from April 2022.
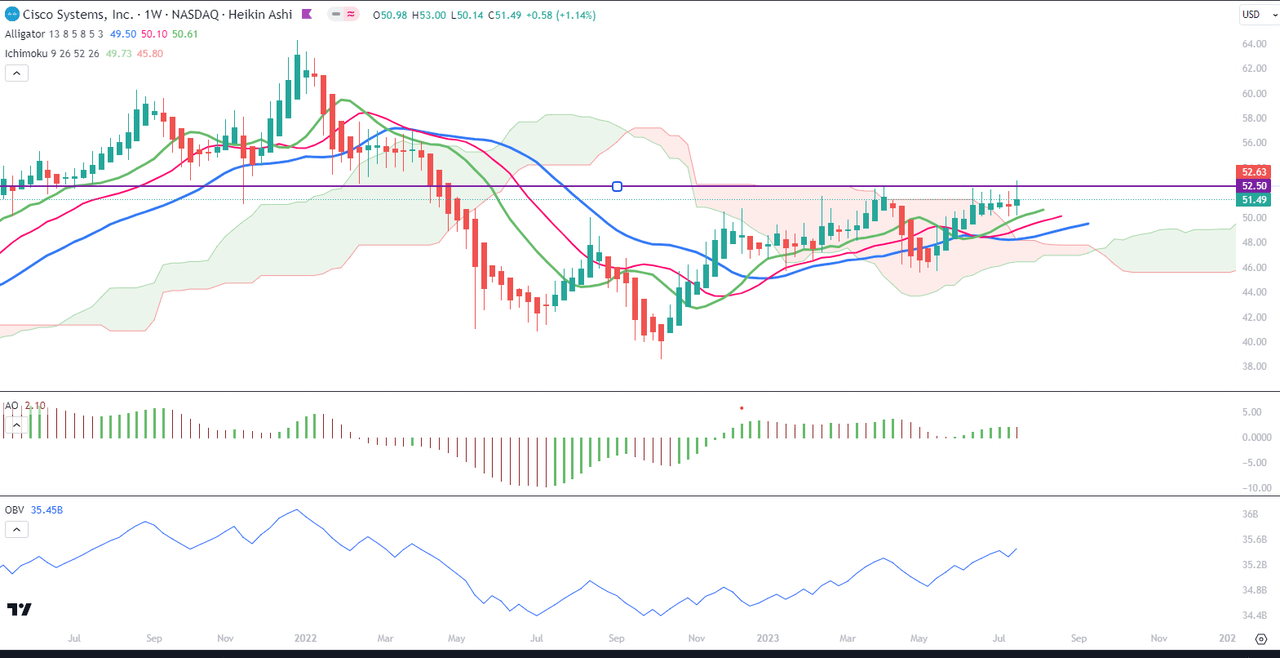
Chart 1 – Weekly (TradingView)
In Chart 2, the 10-week is well above the 50-week MA, and both trend upwards. CIDI has made a downturn above both the fast and the slow averages, while the fast average is approaching the slow one from below. The topping of CIDI may predict a short-term correction, as mentioned in the paragraph above on Chart 1. MACD and its signal are above the zero level but both have a flat position, not showing any direction. We can also see that the DI+ line has been for some time already above the DI-, and keeping distance between both lines.
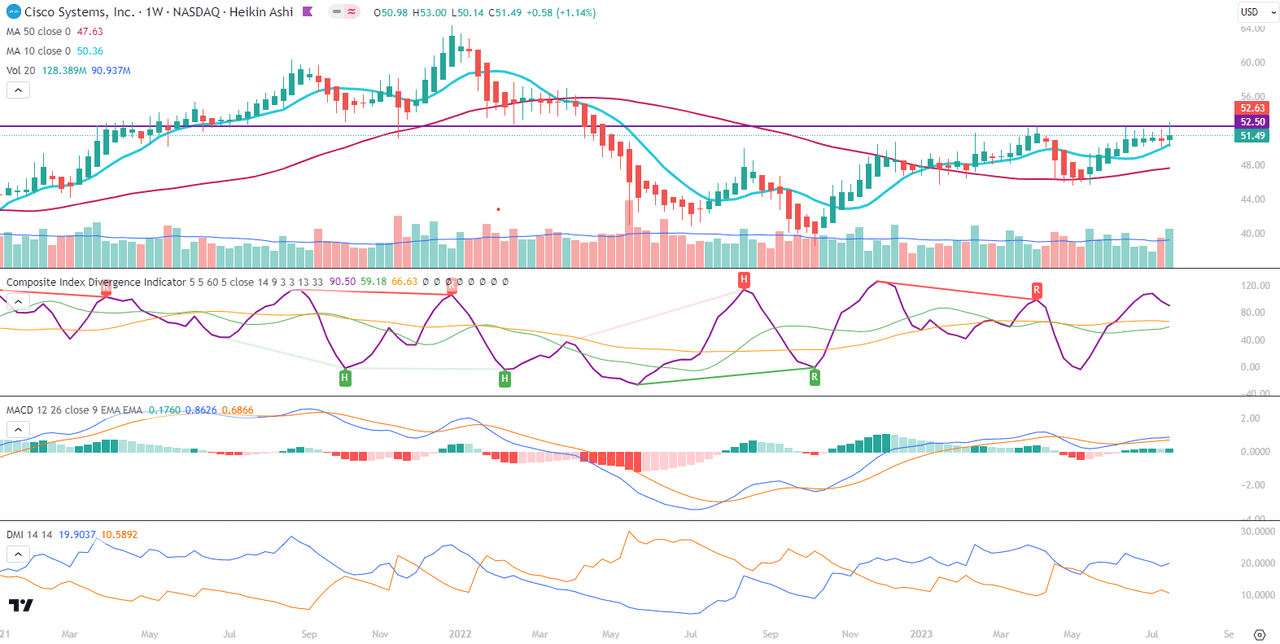
Chart 2 – Weekly (TradingView)
The indicators on both charts in the weekly timeframe are in positive positions but some signs of divergence in momentum make me think of a possible correction to the S/R levels around $48-49 and that we are dealing in fact with a stage of an accumulation period in motion since October 2022.
On the daily Renko chart, Cisco’s stock is in a positive momentum since May. The blue 10-box MA is well above the red 50-box MA line and both are trending upwards. We can see a positive momentum in the MACD crossing above its signal while both are above the zero level. Visual check allows us to compare this setup to the uptrend which started in February 2021 around the same lower S/R levels of $48-49.
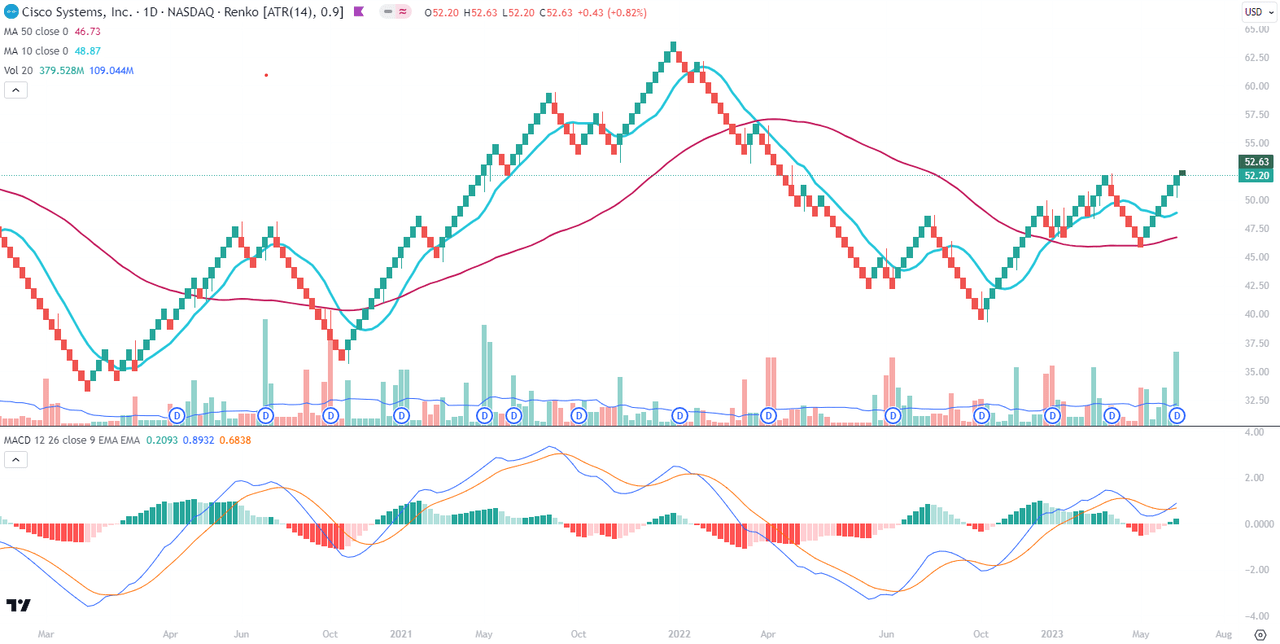
Renko Daily (TradingView)
Conclusions
Overall, the regression-based valuation of Cisco indicates a potential for an upside. Also, the overall mood of technical indicators is rather positive. However, I can see (again) a slight indecision in the way momentum develops, possibly as a part of accumulation. On much higher timeframes it might be necessary for the price to build a strong base around $52-53 after a period of rest, accumulation, or a temporary correction to levels of $48, in order to possibly drive to the next target around $60.
Read the full article here