By Wenli Bill Hao
For market participants seeking to measure small-cap, multi-factor equity premia with greater diversification and historically lower tracking error (TE), S&P DJI has recently launched the S&P SmallCap 600® Quality, Value, Momentum and Low Volatility (QVML) Top 90% Multi-Factor Index.
In this blog, we will examine the index construction methodology, historic performance, sector composition and factor exposure.
Methodology Overview
The S&P SmallCap 600 QVML Top 90% Multi-Factor Index uses a systematic bottom-up approach to select the top 90% stocks, ranked by their multi-factor scores, from the S&P SmallCap 600® universe. Moreover, the constituents are weighted by floated-adjusted market cap (FMC) and rebalanced quarterly. Here, the multi-factor score is defined as the average of the underlying quality, value, momentum and low volatility Z-scores.1 In essence, the index excludes the bottom 10% lowest-ranked constituents based on their multi-factor scores.
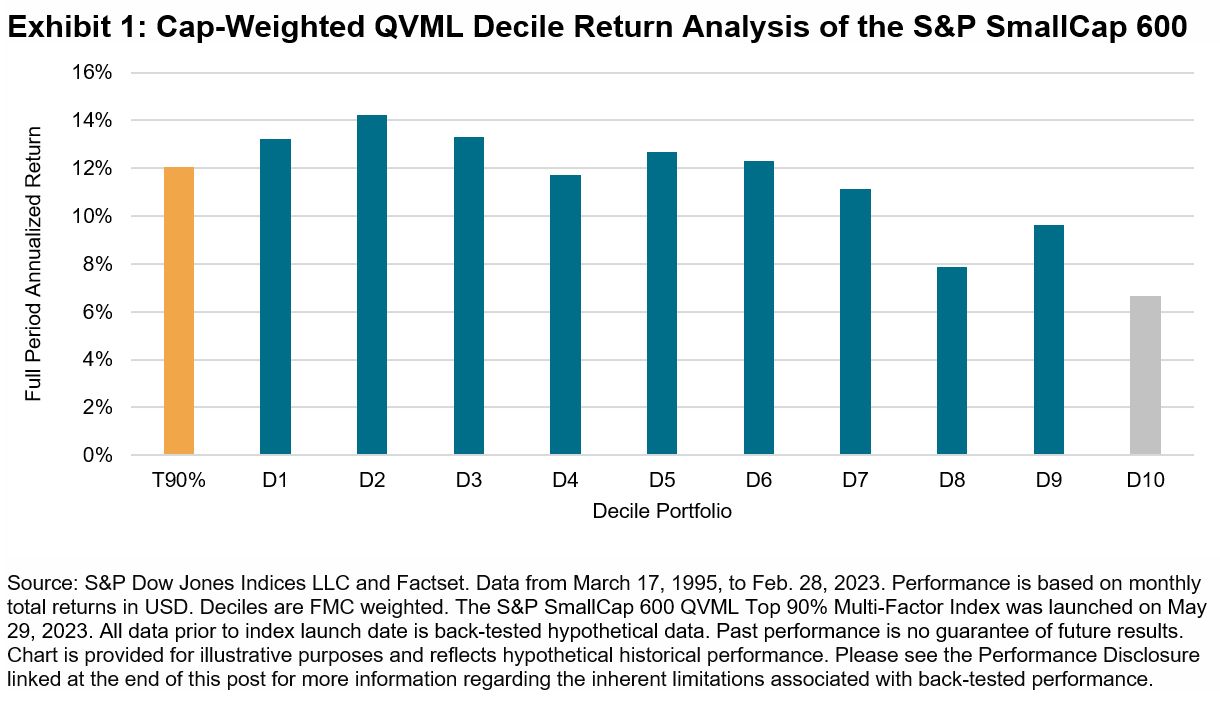
Empirical back-tested analysis shows that, in the S&P SmallCap 600 universe, the lowest-ranked decile exhibited the lowest performance over the period tested. Hence, T90%, which removes the lowest-ranked decile, would have outperformed the S&P SmallCap 600. Here, stocks have been ranked by their multi-factor score and grouped into deciles (D1 = the highest ranked, D10 = the lowest-ranked), as shown in Exhibit 1.
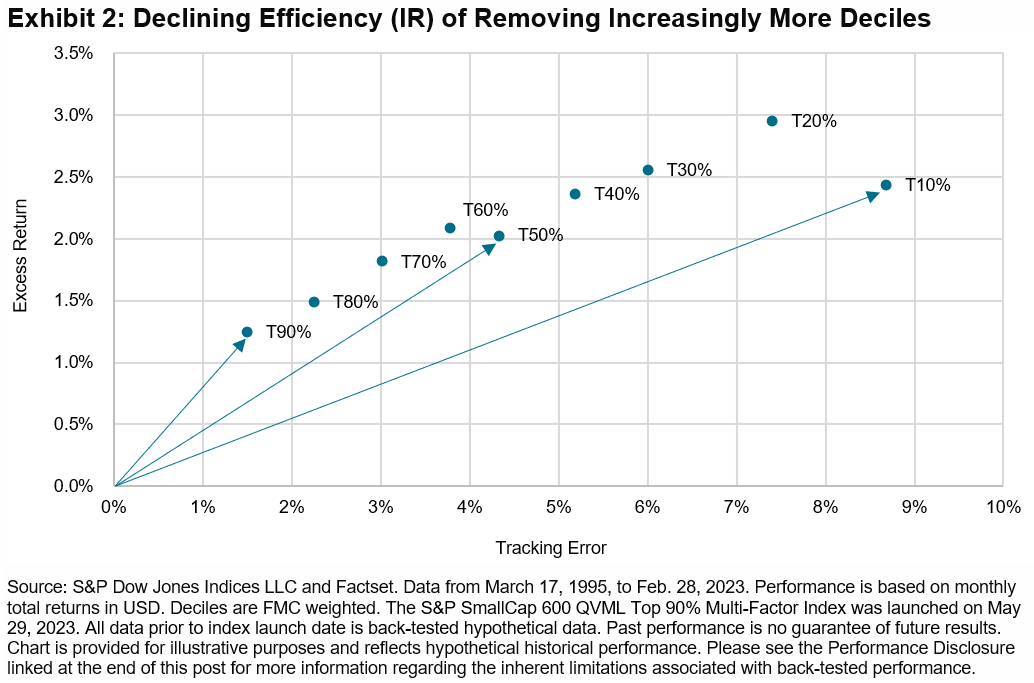
The S&P SmallCap 600 QVML Top 90% Multi-Factor Index was designed to have high diversification and low TE to its benchmark. The slopes of the lines in Exhibit 2 represent the information ratios (IR; defined as the ratio of annualized excess return divided by annualized TE) for a series of indices, each differentiated by the number of deciles removed. For example, T90% removes only the lowest-ranked decile (ranked by multi-factor score), T80% removes the two lowest-ranked deciles (i.e., the 20% lowest-ranked stocks) and so on.
As shown in Exhibit 2, T90% had the highest IR. As more deciles were removed from the back-tested results, their IRs became lower, which means the excess risk (TE) was not proportionally compensated by the excess return.
Performance Comparison
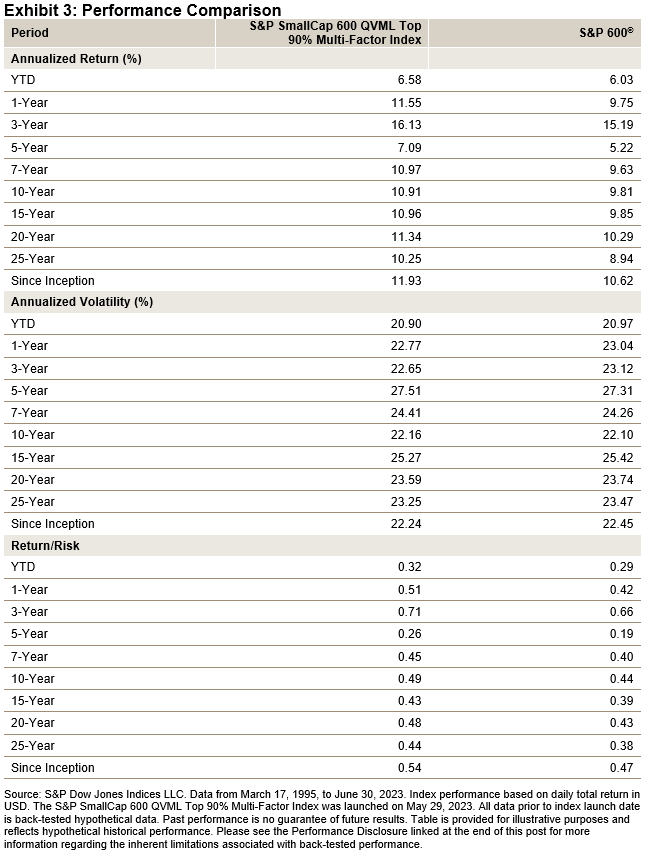
Historically, the S&P SmallCap 600 QVML Top 90% Multi-Factor Index outperformed its benchmark for all periods studied, in both the long and short term, and in terms of both total returns and risk-adjusted returns (see Exhibit 3). The empirical results show that multi-factor premia do exist over the long-term horizon.
Tracking Error and Information Ratio
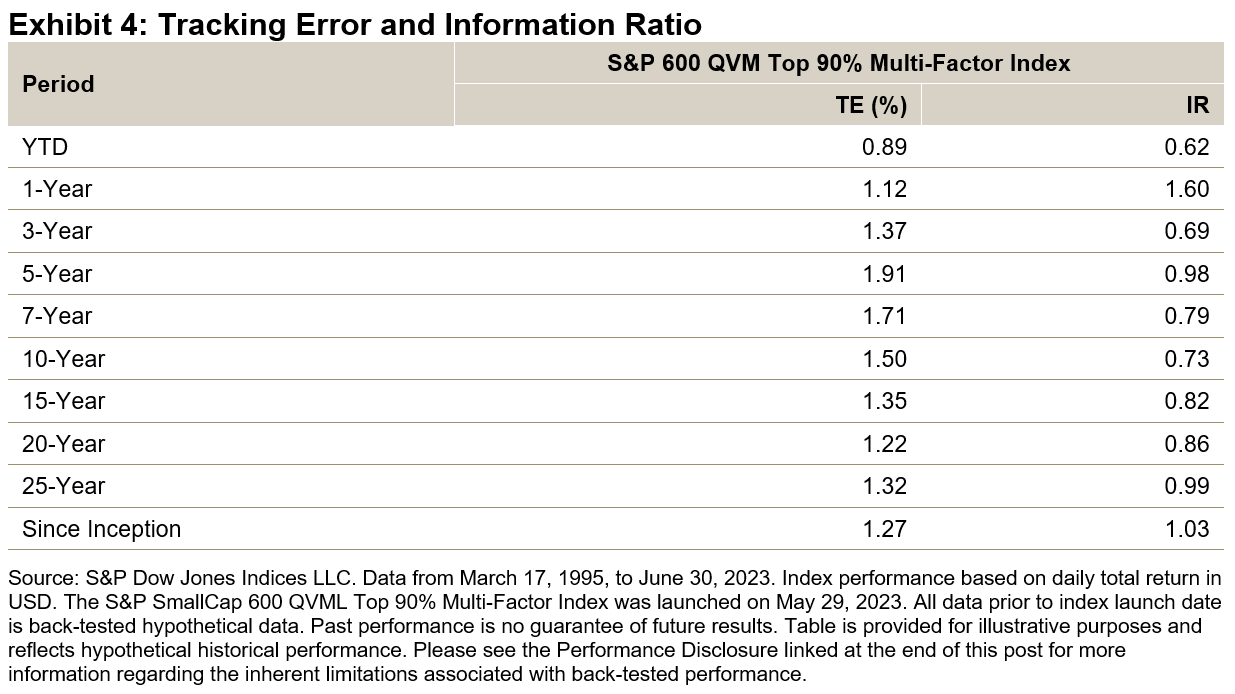
Given the index design, the S&P SmallCap 600 QVML Top 90% Multi-Factor Index had a low TE over time, based on daily total return calculation (see Exhibit 4). Through targeted multi-factor exposure, the strategy generated excess return and had a positive IR for all periods studied, in both the short and long term.
Sector Composition
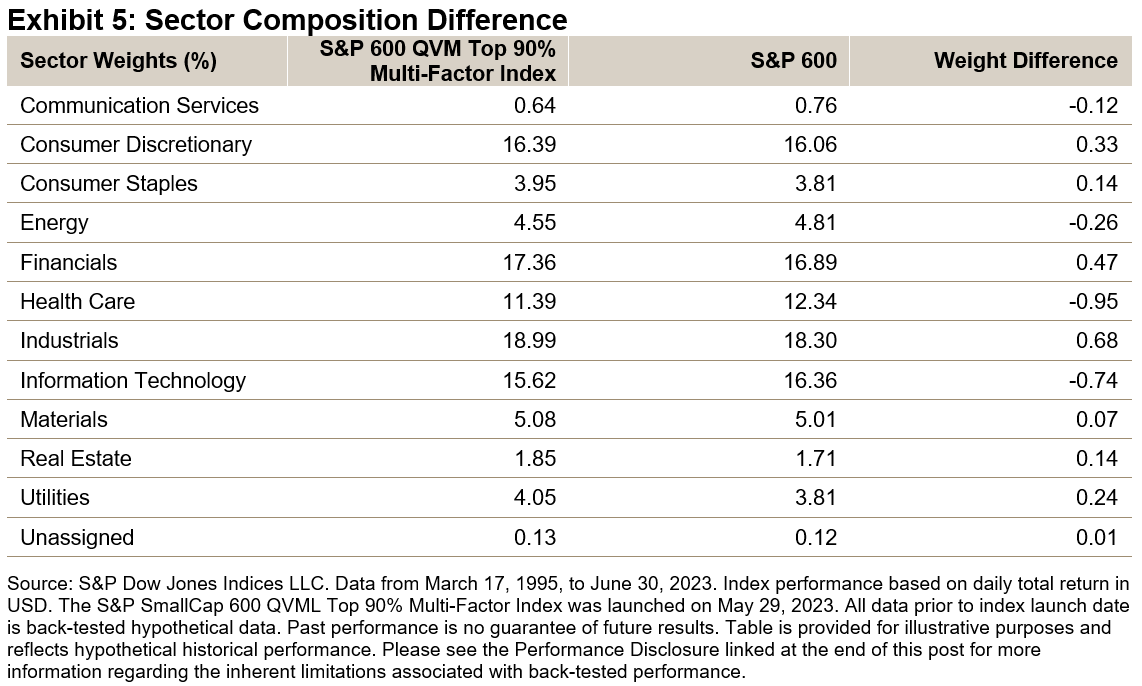
Exhibit 5 shows the historic sector exposures of the S&P SmallCap 600 QVML Top 90% Multi-Factor Index and the S&P 600. The small sector exposure differences (less than 1%) for all sectors show that the strategy has retained the core characteristics of its benchmark historically.
Factor Exposure
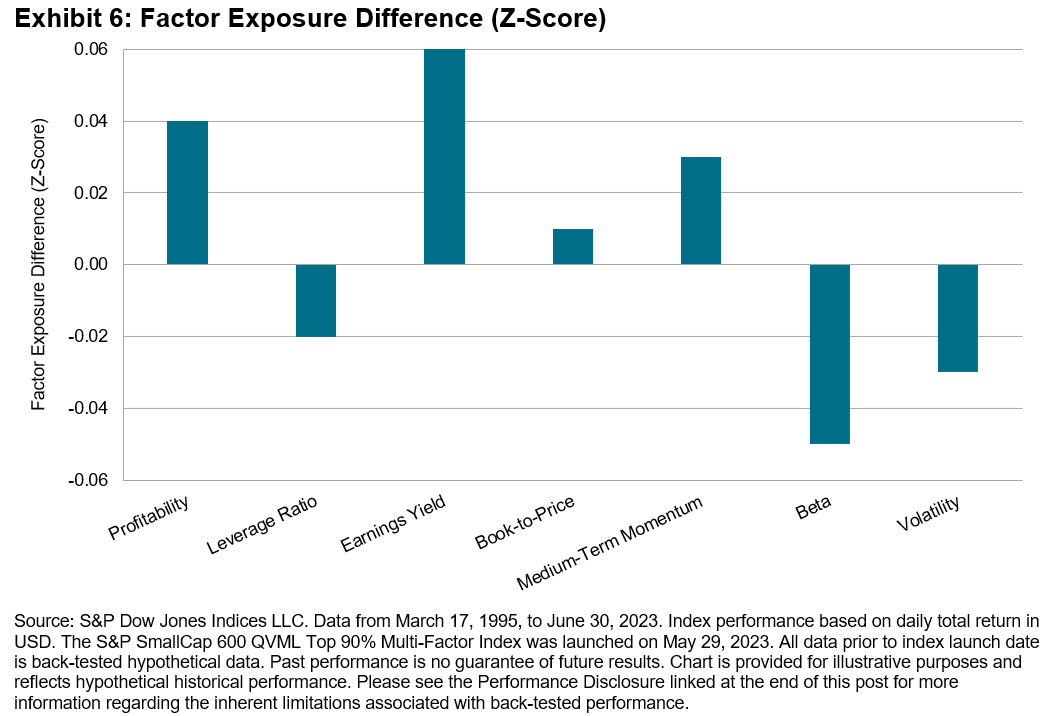
Exhibit 6 illustrates the factor exposure difference of the S&P SmallCap 600 QVML Top 90% Multi-Factor Index versus the S&P 600, as measured through the lens of the Axioma Risk Model Factor Z-scores. The strategy had higher exposures to quality (higher profitability and lower leverage ratio), value (higher earnings yield and the book-to-price ratio) and momentum, while it had lower volatility (lower beta and volatility). The findings are in line with the index design, which selects the top 90% stocks in terms of their multi-factor scores.
1 Please refer to the S&P QVML Multi-Factor Indices Methodology for more details.
Disclosure: Copyright © 2023 S&P Dow Jones Indices LLC, a division of S&P Global. All rights reserved. This material is reproduced with the prior written consent of S&P DJI. For more information on S&P DJI please visit www.spdji.com. For full terms of use and disclosures, please visit www.spdji.com/terms-of-use.
Original Post
Editor’s Note: The summary bullets for this article were chosen by Seeking Alpha editors.
Read the full article here


