Investment Thesis
Earnings performance and outlook –
Continuing earnings beats –
Applied Industrial Technologies (NYSE:AIT) has grown net income at an average rate of just over 20% per year over the last six years through December 31, 2022. The company continues to surprise, beating analysts’ estimates by wide margins. Out of interest I did the calculation, and over the last 12 quarters (3 years), through end of Q1 2023, AIT has beaten analysts’ consensus estimates by 21.4% on average. Their worst result in that time was a beat of only 7.9% in September quarter 2021. Back in February 2022 in my article, “Applied Industrial Technologies: On A Roll“, I wrote, “On the back of a string of 10 quarterly EPS beats, analysts have lifted their expectations for Applied Industrial Technologies.” Obviously, based on continuing strong beats they did not lift their expectations enough. Since I published the above article, with a Buy rating, the AIT share price has increased by 36.52% compared to a decrease of 10.19% in the S&P 500. I must say I have some sympathy for analysts because AIT is succeeding in growing the bottom line at what seems an unbelievable rate compared to top line revenue growth.
How AIT achieves unbelievable growth rates –
In January 2023 I took another look at AIT in my article, “Applied Industrial Technologies: Still A Buy”. At that time I was concerned how AIT could continue to grow profits at such a faster rate than revenue growth. I took a deep dive analysis and determined between 2019 and 2022, “The answer to the high operating growth rate is the containment of growth in Selling, distribution & administrative expenses (“SD&A”) to just 0.3% per year. This boosted the growth rate by 7.3 percentage points from 3.2% at the Gross profit level to 10.5% at the Operating income level, providing the “robust operating leverage” referred to by the CEO.” I also looked at the segments and discovered the fastest growing segment, Engineered Solutions, has the highest operating margin further leveraging results. I then looked at the most recent data available at that time, the September 2022 quarterly results (AIT’s Q1 2023) with the following result, ” Results for Q1-2023 show even better Net income average yearly growth rates than those for FY-2022, 25.6% versus 13.6%. Lower interest expense has again contributed, and Operating income growth rate is 20.3% versus 10.5% for FY-2022. Again a low SD&A growth rate of 1.7% compared to a Gross profit growth rate of 6.9% has provided that “robust operating leverage” resulting in the Operating income growth rate of 20.3%.”
Earnings outlook –
Since my January 2023 article linked above, AIT’s share price has increased by 8.56% compared to a 2.55% increase in the S&P 500. On the March quarter 2023 earnings call, per SA transcript, AIT President and Chief Executive Officer, Neil Schrimsher gave a comprehensive review of the quarter past and outlook. Below are some relevant excerpts,
So overall, we had another solid quarter demonstrating our industry position and operational focus. We grew EBITDA by 29% and adjusted EPS by 36% on approximately 15% sales growth…. We did this against the backdrop of ongoing inflationary pressures and supply chain constraints as well as some moderation in broader market activity… customer activity remained generally positive during the quarter... Growth was strongest in many of our top industry verticals and across our larger national account base... also capturing new business opportunities from our industry position and technical capabilities… seeing more and more examples of cross selling success… As expected, we did see broader market activity normalized some as the quarter progressed…
and on outlook –
Sales month-to-date in April are trending up a high single-digit percent on an organic basis versus the prior year…. we’ve remained mindful of ongoing macro headwinds that could weigh on near-term market activity. That said, as we highlighted before, we are favorably positioned to continue to outperform the broader market… our ability to capitalize on key secular growth trends gaining momentum across the North American industrial sector. This includes greater infrastructure spending, re-shoring and aging and scarce technical labor force and incremental growth from government stimulus spending… many of our top industry verticals in the U.S. remained strong in the quarter with greater than 20% growth within food and beverage, pulp and paper, chemicals and mining.
EPS estimates –
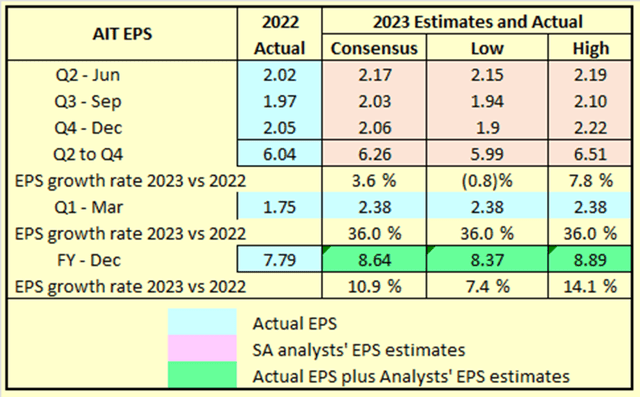
Table A below shows SA analysts 2023 quarterly estimates compared to actual EPS for year ended December 2022 (note that AIT has a June 30 fiscal year end but I find it useful to conduct most analysis on a standard calendar year basis).
Table A
Data ex SA Premium
Table 2 shows most of the estimated growth in 2023 versus 2022 EPS has already occurred in Q1- March, with a 36% period on period growth rate. For the nine remaining months of 2023, analysts’ consensus is for 3.6% growth over the comparable period in 2022. The analysts’ high forecast is for 7.8% growth, and if AIT continues to beat, that could be closer to the mark. Table B below looks at EPS growth estimates for 2024 versus 2023.
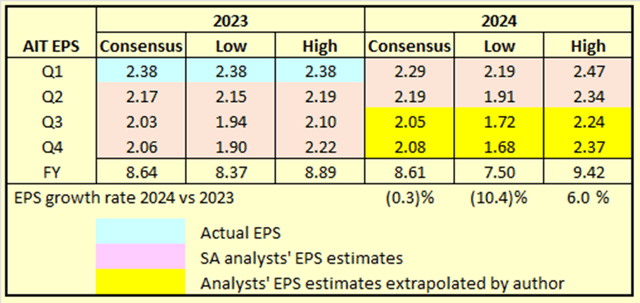
Table B
Data ex SA Premium
SA analysts’ estimates for AIT only extend to June quarter 2024, so I have extrapolated to end of December 2024, for completeness. Only the high estimate for Q1 2024 exceeds the strong Q1 2023 actual result, with Consensus and Low estimates well below 2023. For Q2, the consensus estimate for 2024 of $2.19 is slightly above the consensus estimate for 2023 of $2.17, while Low is significantly below and High significantly above. For completeness I have extrapolated the Q2 2024 estimates through the end of year to gain a picture of possible range in which actual results might fall. The resulting estimates show EPS growth relatively flat for Consensus, modest growth of 6% based on High, and ~10% decline based on Low.
Dividend growth and outlook –
Despite the exceptional earnings growth, dividend increases have been limited to a regular $0.04 per year since 2016, resulting in growth a little over 3% per year. With the share price growing strongly, the dividend yield has fallen from 1.89% in 2016 to 1.03% today. Relatively low dividend growth and yield likely reduces the attractiveness of the stock for dividend growth investors. On the other hand, for growth investors the strong investment in operating assets together with acquisitions would likely be an attraction. Should operating growth slow, reducing need for investment in operations, debt levels are modest, and it is possible surplus free cash flows could be diverted to increase dividend growth, and for share buybacks.
Summary and conclusions
There still appears to be upside potential in AIT, and management appears highly competent. There do appear to be risks of lower EPS growth emerging which management may well navigate their way around. Lower growth might lead to a greater portion of cash flows diverted away from additional investment in operating capability and towards increased dividends and possibly share buybacks. From the March quarter earnings call,
In addition, we’ll continue to evaluate share buybacks and ongoing dividend growth as secondary options to deploy capital and drive returns.
On balance, I rate AIT a hold for existing investors and a potential buy for others, with an understanding there is downside risk accompanying upside potential. A more detailed financial analysis follows below.
A More Detailed Financial Analysis
Just because the operations of a listed business perform well does not mean buying shares in that business at any given point in time will result in that investment performing well. My main aim in this more detailed financial analysis is to analyze financial data with regard to –
Total Return, Dividends, and Share Price
The only way an investor can achieve a positive return on an investment in shares is through receipt of dividends and/or an increase in the share price above the buy price. It follows what really matters in share value assessment is the expected price at which a buyer will be able to exit shares, and expected cash flow from dividends.
Changes in Share Price
From a purely mathematical/statistical point of view, changes in share price are driven by increases or decreases in EPS and changes in P/E ratio. Changes in P/E ratio are driven by investor sentiment toward the stock. Investor sentiment can be influenced by many factors, not necessarily stock-specific.
“Equity Bucket”
Earnings are tipped into the “Equity Bucket” for the benefit of shareholders. It’s prudent to check whether distributions out of and other reductions in the “Equity Bucket” balance are benefiting shareholders.
Summarized in Tables 1, 2, and 3 below are the results of compiling and analyzing financial data with the foregoing in mind.
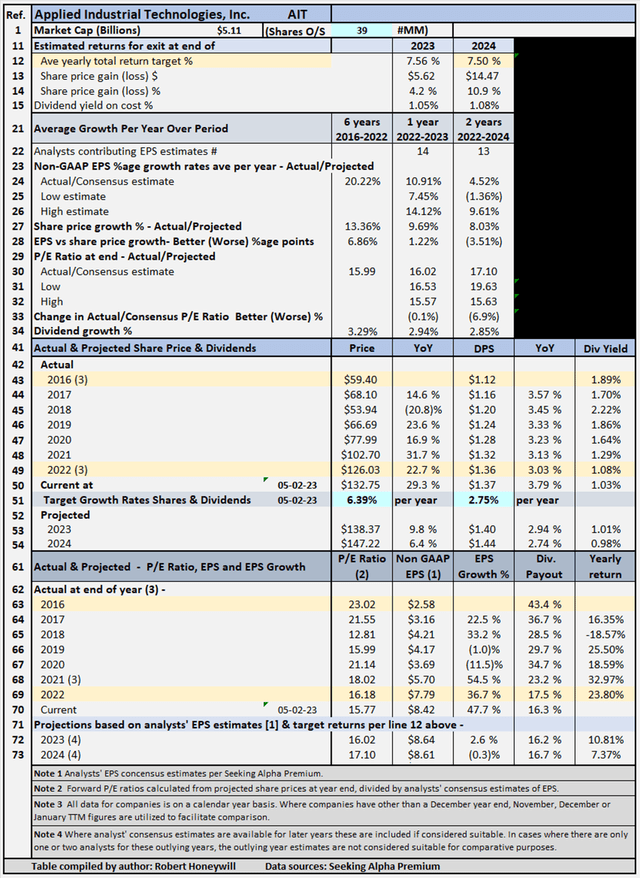
Table 1 – Detailed Financial History And Projections
Seeking Alpha Premium
Table 1 analyses historical data from 2016 to 2022, including share prices, P/E ratios, EPS and DPS, and EPS and DPS growth rates. For the six years 2016 to 2022, AIT has grown EPS at an average yearly rate of 20.22%. Average yearly share price growth of 13.36% is less than the EPS growth rate of 20.22% due to P/E multiple contraction from 23.02 at end of 2016 to 16.18 at end of 2022. This is over a period when multiples for many stocks have shown significant expansion. I believe it is likely the multiple contraction is a lack of belief in the market, the EPS growth rate, and/or the current level of profitability can be sustained into the future. Another factor possibly limiting share price growth is the low dividend growth rate and consequently declining dividend yield as shown in Table 1 above.
The table also includes estimates out to 2024 for share prices, P/E ratios, EPS and DPS, and EPS and DPS growth rates (note – while estimates are shown for analysts’ EPS estimates out to 2023 through 2026 where available, estimates do tend to become less reliable the further out the estimates go. These estimates are generally only considered sufficiently reliable if there are at least three analysts’ contributing estimates for the year in question). Also, please refer to Tables A and B above and related discussion in relation to EPS estimates included above.
Table 1 allows modeling for target total rates of return. In the case shown above, the target set for total rate of return is 7.5% per year through the end of 2024 (see line 12), based on buying at the May 2, 2023, closing share price level. As noted above, estimates become less reliable in the later years. In the case of AIT, I have decided to input a target return based on 2024 year, which has EPS estimates from three analysts, with some extrapolation as discussed further above, to gain a picture of possible returns from a medium term hold. The table shows that to achieve the 7.5% return, the required average yearly share price growth rate from May 2, 2023, through December 31, 2024, is 6.39% (line 51). Dividends, including estimated dividend increases, account for the balance of the target 7.5% total return.
AIT’s Projected Returns Based On Selected Historical P/E Ratios Through End Of 2024
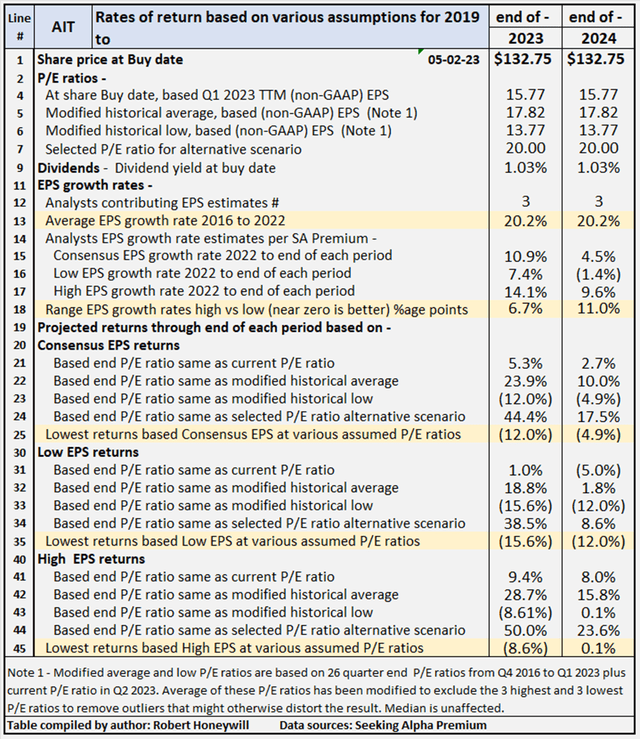
Table 2 below provides scenarios projecting potential returns based on select historical P/E ratios and analysts’ consensus, low, and high EPS estimates per Seeking Alpha Premium through the end of 2024.
Table 2 – Summary of relevant projections AIT
Seeking Alpha Premium
Table 2 provides comparative data for buying at the closing share price on May 2, 2023, and holding through the end of 2024. There’s a total of twelve valuation scenarios for the year, comprised of three EPS estimates (SA Premium analysts’ consensus, low, and high – with Q3 and Q4 2024 extrapolations as discussed further above) across four different P/E ratio estimates, based on historical data. AIT’s P/E ratio is presently 15.77, based on TTM Q1 2023 non-GAAP EPS. For AIT, the present P/E ratio is below the modified average of historical P/E ratios over the last six years. Table 2 shows potential returns from an investment in shares of the company at a range of historical level P/E ratios. This analysis, from hereon, assumes an investor buying AIT shares today would be prepared to hold through end of 2024, if necessary, to achieve their return objectives. Comments on contents of Table 2, for the period to 2024 column follow.
Consensus, low, and high EPS estimates
All EPS estimates are based on analysts’ consensus, low, and high estimates per SA Premium. This is designed to provide a range of valuation estimates ranging from low to most likely to high based on analysts’ assessments. I could generate my own estimates, but these would likely fall within the same range and would not add to the value of the exercise. This is particularly so in respect of well-established businesses such as AIT. I believe the “low” estimates should be considered important. It’s prudent to manage risk by knowing the potential worst-case scenarios from whatever cause.
Alternative P/E ratios utilized in scenarios
- The current P/E ratio. This scenario provides a range of potential returns if the P/E ratio remained at the current level through end of 2024.
- A modified average P/E ratio based on 26 quarter-end P/E ratios from Q4 2016 to Q1 2023 plus the current P/E ratio in Q2 2023. The average of these P/E ratios has been modified to exclude the three highest and three lowest P/E ratios to remove outliers that might otherwise distort the result. The present P/E ratio is close to the average so in this instance, this scenario shows indicative returns similar to if the multiple stayed around current levels through the end of 2024.
- A modified historical low P/E ratio calculated using the same data set used for calculating the modified average P/E ratio, with the three highest and lowest P/E ratios excluded.
- A selected P/E ratio to provide an alternative P/E scenario to take into account other factors that might be relevant to assessing potential returns. For example, if analysts’ forward estimates reflected EPS growth rates significantly higher or lower than historical EPS growth rates. In such cases the forward P/E ratio might be expected to trend higher or lower than the historical average. In the case of AIT, the P/E ratio has exceeded 20.00 for nine of the 27 quarters between Q4 2016 and the present quarter. On this basis a selected P/E ratio of 20.00 is included to determine the effect on returns should AIT’s P/E ratio increase to that level by end of 2024. The market generally has experienced significant multiple expansion over the last six years, while AIT’s multiple has declined despite strongly growing EPS. It is not that share price has not grown strongly, just not as fast as the EPS growth, resulting in multiple contraction.
Reliability of EPS estimates (line 18)
Line 18 shows the range between high and low EPS estimates. The wider the range, the greater disagreement there is between the most optimistic and the most pessimistic analysts, which tends to suggest greater uncertainty in the estimates. There are three analysts covering AIT through the end of 2024. In my experience, a range of 11 percentage points difference in EPS growth estimates among analysts is very high, suggesting a considerable degree of uncertainty, and thus lesser reliability.
Projected returns per Table 2 above (lines 20 to 45)
Lines 25, 35 and 45 show if AIT’s P/E multiple were to fall to the modified historical low of 13.77, returns of negative (12.0)% to positive 0.1% could be expected through end of 2024, based on the range of analysts’ EPS estimates. The negative (12.0)% is based on analysts’ low estimates and the 0.1% on their high estimates, with consensus negative (4.9)%. If the multiple increased to the historical average of 17.82, above the current level of 15.77, returns of 1.8% to 15.8% are indicated, with consensus 10.0%. If the P/E ratio should increase further to the level of the selected P/E ratio of 20.00, returns of 8.6% to 23.6% are indicated, with consensus 17.5%. That is a wide range of possibilities, introducing uncertainty, and heightened uncertainty equates to heightened risk. At the same time, if the P/E ratio just remained at the current level and Consensus EPS estimates were met, a total return of 2.7% is indicated, and if consensus estimates were beaten as has happened consistently, EPS at the high estimate level is indicated to return 8.0% per year.
Checking AIT’s “Equity Bucket”
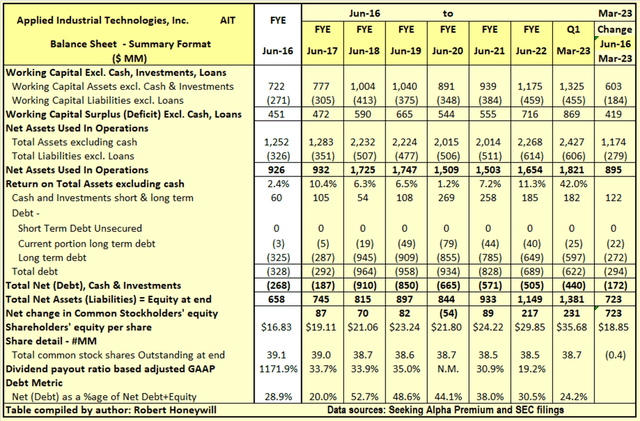
Table 3.1 AIT Balance Sheet – Summary Format
Seeking Alpha Premium & SEC filings
Table 3.1 shows an increase in net operating assets of $895 million funded by an increase of $172 million in net debt, and an increase of $723 million in shareholders’ equity, over the 6.75 years July 1, 2016, to March 31, 2023. Net debt as a percentage of net debt plus equity decreased from 28.9% to 24.2% over the period. Outstanding shares decreased by 0.4 million from 39.1 million to 38.7 million, over the period, due to share repurchases offset by shares issued for stock compensation. The $723 million increase in shareholders’ equity over the last 6.75 years is analyzed in Table 5.2 below.
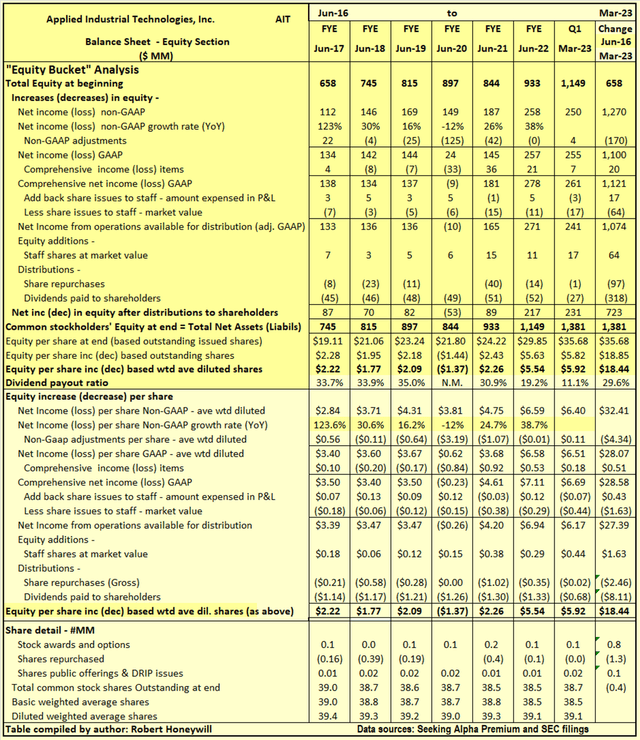
Table 3.2 AIT Balance Sheet – Equity Section
Seeking Alpha Premium & SEC filings
I often find companies report earnings that should flow into and increase shareholders’ equity. But often the increase in shareholders’ equity does not materialize. Also, there can be distributions out of equity that do not benefit shareholders. Hence, the term “leaky equity bucket.” In the case of AIT, there are significant distributions in the form of dividends to shareholders and stock compensation levels are modest.
Explanatory comments on Table 3.2 for the period July 1, 2017 to September 30, 2022:
- Reported net income (non-GAAP) over the 6.75-year period totals to $1,270 million, equivalent to diluted net income per share of $32.41.
- Over the 6.75-year period, the non-GAAP net income excludes $170 million (EPS effect $4.34) of items regarded as unusual or of a non-recurring nature in order to better show the underlying profitability of AIT. In AIT’s case, the excluded items are primarily impairment charges in respect of goodwill and intangibles. Goodwill and intangibles are recorded when a business is acquired for a greater amount than the fair value of the tangible assets acquired. An impairment charge recognizes the amount paid for the business or businesses is greater than their current present value. This of course represents a loss, and a reduction in shareholders’ equity, in the same way as an operating loss. In AIT’s case, the $170 million loss from impairments is significant, being 13.4% reduction of the $1,270 million non-GAAP earnings reported for the 6.75-year period.
- Other comprehensive income includes such things as foreign exchange translation adjustments in respect to buildings, plant, and other facilities located overseas and changes in valuation of assets in the pension fund – these are not passed through net income as they fluctuate without affecting operations and can easily reverse in a following period. Nevertheless, they do impact on the value of shareholders’ equity at any point in time. For AIT, these items were $20 million positive (EPS effect $0.51) over the 6.75-year period.
- There were shares issued to employees, but these were not a significant expense item. The amounts recorded in the income statement and in shareholders’ equity, for equity awards to staff, totaled $17 million ($0.43 EPS effect) over the 6.75-year period. The market value of these shares is estimated to be $64 million ($1.63 EPS effect). The understatement of expense by $47 million is not material in the context of non-GAAP earnings total of $1,270 million over the 6.75 year period, and not concerning from a “leaky equity bucket” aspect.
- By the time we take the abovementioned items into account, we find, over the 6.75 year period, the reported non-GAAP EPS of $32.41 ($1,270 million) has decreased to $27.39 ($1,074 million), added to funds from operations available for distribution to shareholders.
- Dividends of $318 million, and share repurchases of $97 million were adequately covered by the $1,074 million generated from operations, leaving a balance of $659 million added to equity. Shares to staff at market value of $64 million further increased this $659 million to $723 million added to equity, per increase in shareholders’ funds per Table 3.1 above.
Summary and Conclusions
The dividend is very safe but provides a low yield ~1%. The company could quite easily double this dividend and still have a low payout ratio. That would likely have a positive impact on the share price. It seems the company has put more weight on increasing operating assets totally out of free cash flows, as debt has been reduced despite significant additional investment in operating assets over the last 6-7 years. While the CEO has indicated continuing strong growth in April 2023 versus April 2022, that does not necessarily mean strong sequential period growth. That might not be all bad as a flattening in growth might mean lower expenditure on operating assets leading to more free cash flow being allocated to dividends or share buybacks, either of which could support some further growth in share price.
With regards to the rating, I am a bit mixed on AIT at this point in time due to uncertainty on the rate management can grow EPS going forward, and whether sentiment will cause the P/E multiple to increase and decrease. I am encouraged by a belief management is extremely capable and competent to meet any challenges, whether operational or financial, enabling them to do the best in shareholder interests.
On balance, I rate AIT a hold for existing investors and a potential buy for others, with an understanding there is downside risk accompanying upside potential.
Read the full article here


