It was a banner 4th of July holiday period for the airline industry. According to TSA throughput data, total traffic eclipsed the previous record peak set in 2019. Clearly, there are tailwinds for airlines, but I reiterate my hold rating on Allegiant Travel Company (NASDAQ:ALGT) while fully admitting that my cautious stance in January was too bearish.
TSA trailing 7-day throughput is about 107% recovered vs. 2019 levels
BofA Global Research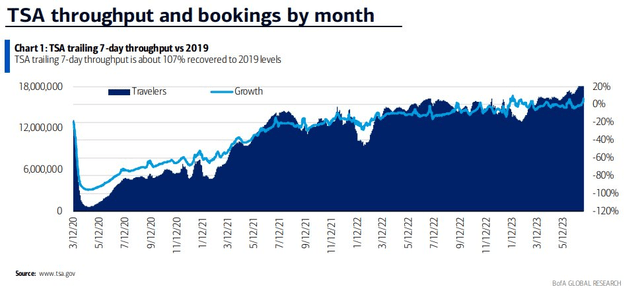
According to Bank of America Global Research, ALGT is a low-fare, low-utilization carrier with a unique business strategy, flying where others do not. ALGT primarily serves leisure travelers in small and medium-sized cities, flying 615 routes to 132 cities. It actively manages capacity to match demand patterns by flying each route only a few times a week and uses older planes with low capital costs. An early unbundler, the firm generates more fees per passenger than any U.S. airline. ALGT’s largest markets are Orlando, Las Vegas, and Tampa.
The Las Vegas-based $2.2 billion market cap Passenger Airlines industry company within the Industrial sector trades at a high 33.6 trailing 12-month GAAP price-to-earnings ratio and does not pay a dividend, according to Seeking Alpha. Ahead of earnings in early August, the stock has a somewhat high 45% implied volatility percentage and material short interest of 4.1%.
On July 18, ALGT reported its June traffic data, and I found the results encouraging. There were year-on-year gains in passenger traffic and the sequential change compared to May’s metrics was encouraging. Shares traded higher by more than 2% shortly after the numbers were reported.
ALGT June 2023 Traffic Looks Modestly Impressive, Sequential Improvement
Allegiant IR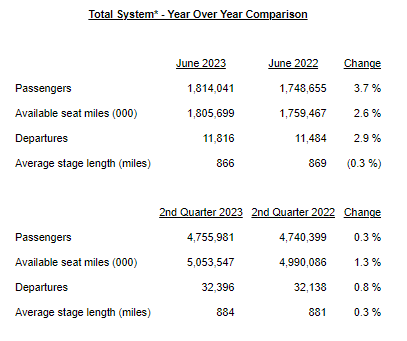
Bigger picture, Allegiant topped earnings estimates back in May and beat the consensus revenue expectation. With sales up 30% year-on-year and EPS summing to $3.04, the airliner’s total revenue per available seat mile (TRASM) surged 29% from the same period a year ago while its quarterly load factor surged a nice 6.9% to 85.8%, among the highest in the industry. There were positive EPS revisions care of fuel cost adjustments, and the management team raised its 2023 EPS outlook to $7.75-$11.75 compared to the previous $5-$9 range.
Key risks include macro uncertainty in the second half and into 2024 as well as rising labor cost pressures. I detailed ongoing issues with the embattled 737 MAX in my previous analysis – this is still a source of concern. It is key for the ALGT bulls to acknowledge that jet fuel prices declined big in the previous quarter, accounting for a massive $6 of EPS benefit, so that might be a transitory feature.
On valuation, analysts at BofA see earnings surging to nearly $9 this year with continued robust growth in the out year through 2025. The Bloomberg consensus outlook is less upbeat for 2023 and 2024, though it also projects more than $13 of operating per-share profits in FY 2025. Still, no dividends are expected to be paid on this airline stock. With a low 10.1 forward non-GAAP P/E and an ultra-cheap EV/EBITDA ratio, there are reasons to like the stock on valuation. But notice in the graphic below that free cash flow is expected to be in the red through next year, that might be a better sign of profitability.
Allegiant: Big EPS Growth Expected, But Free Cash A Sore Spot
BofA Global Research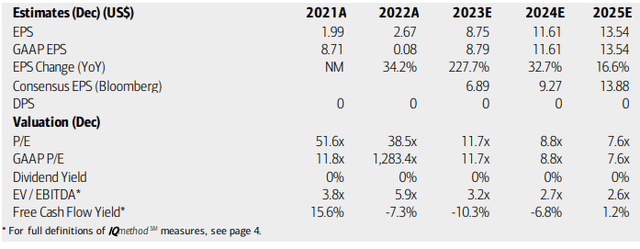
If we apply a low teens forward operating earnings multiple (about on par with discount airline peers when normalizing EPS figures) and assume $9 of next-12-month EPS, then the stock should trade near the $110 to $120 area, not far from where the stock sells for today. So, I am a hold on valuation.
ALGT: Low P/E, But In Line With Competitors
Seeking Alpha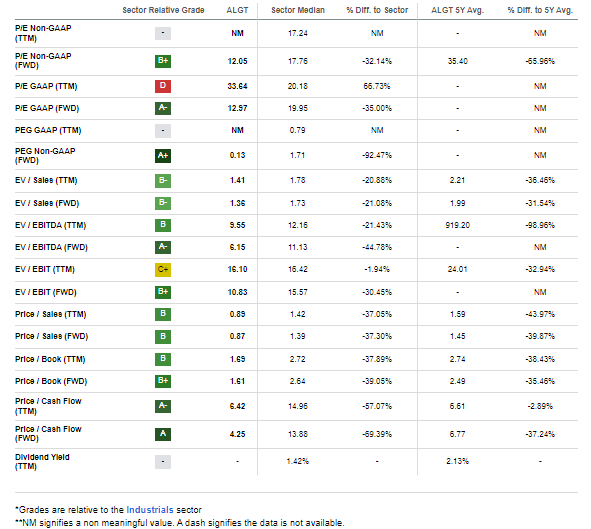
Looking ahead, corporate event data provided by Wall Street Horizon show a confirmed Q2 2023 earnings date of Wednesday, August 2 before the open. No other corporate news events are seen on the calendar now that June traffic numbers have been reported today.
Corporate Event Risk Calendar
Wall Street Horizon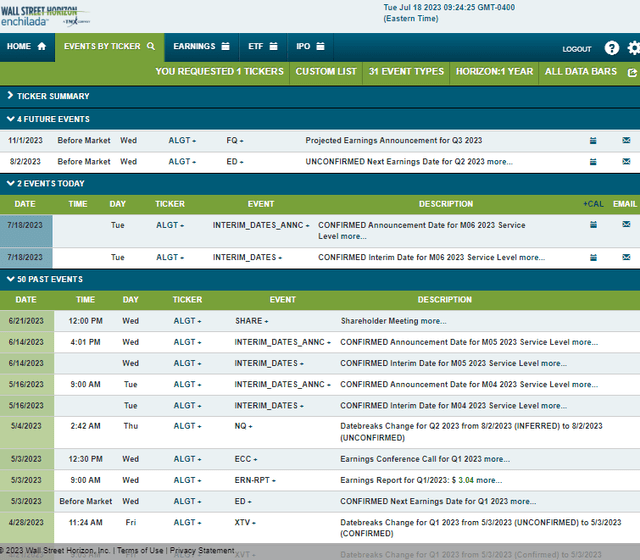
The Technical Take
I was clearly wrong in my neutral stance on ALGT earlier this year. The stock has taken flight, rising some 40% from January. Busting through resistance levels along the way, notice in the chart below that the long-term 200-day moving average is rising, indicating that the bulls are in charge (there was a successful test of the 200dma last month). What’s more, the RSI momentum indicator at the top of the graph is now in the bullish 40 to 90 zone after being stuck in bearish territory for many quarters over the past three years.
I see support at a point of polarity in the $102 to $110 range with more potential buyers stepping up near $85. Resistance is apparent in the low $130s, though, and ALGT has paused here over the last month following a massive ascent during much of June. With a bearish to bullish reversal persisting, the technical construct is bullish.
ALGT: Bullish Run YTD, $130-$132 Resistance, Buy A Dip To $102
StockCharts.com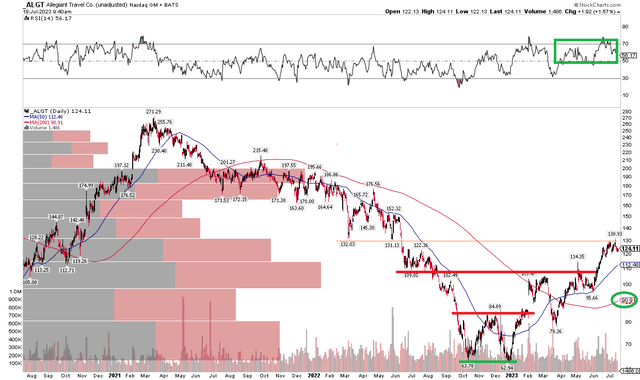
The Bottom Line
I reiterate my hold rating on ALGT. I feel more upbeat considering there are definitive signs that the stock has bottomed out, but the valuation case is softer today. A pullback to the low $100s (support) would be an optimal spot to buy the dip.
Read the full article here


