It has been roughly four months since the regional banking crisis started with the failure of Silicon Valley Bank in March. With several months of distance, it’s a good time to review the core issue that caused the regional banking crisis, what has happened to the bank balance sheet in the aftermath of the crisis, and what this means for the US economy going forward.
Banks extend credit to the economy in the form of buying securities and making loans. The economy operates on credit expansion which is why it’s very rare to see bank credit contract.
Bank credit fell sharply in the days following the SVB failure and has not recovered as banks have little interest in extending credit to the economy under the current conditions of an inverted yield curve and recessionary pressure.
Federal Reserve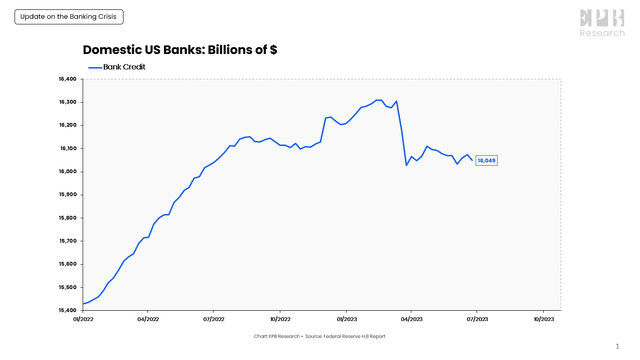
Total bank credit today is lower than it was in Q4 of last year, so we’re going on several quarters of declining bank credit, a rare situation that only occurs when the banking system is under stress.
The growth rate of bank credit shows a clearer picture. At the start of 2022, banks were extending credit to the economy at a 10% annualized rate. As the Fed started Quantitative Tightening and raising interest rates, bank credit growth slowed to about 2% before abruptly contracting after the SVB failure. Now we see bank credit in contraction over the last six months.
Federal Reserve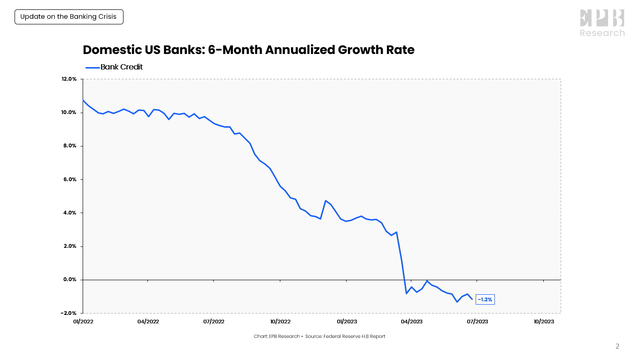
With that context, let’s review the core issue that led to the start of this regional banking crisis and then take a look at the asset side of the collective bank balance sheet to see what changes banks are making in the aftermath of the crisis and how this will impact the economy going forward.
As the Federal Reserve started raising interest rates and yields on Treasury Bill started climbing to 3%, 4%, and even 5%, an alternative emerged to parking your money in a savings or checking account and earning 0%.
Federal Reserve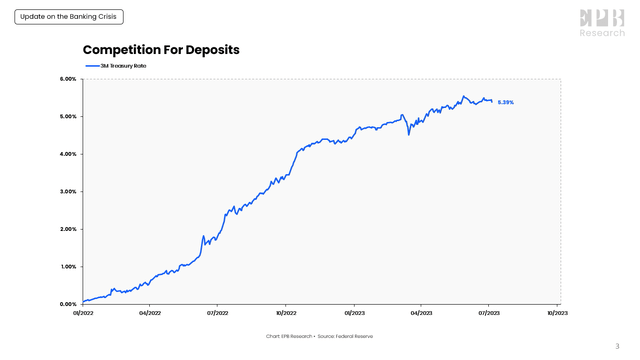
In addition, the Federal Reserve started reducing the size of its balance sheet through quantitative tightening.
Federal Reserve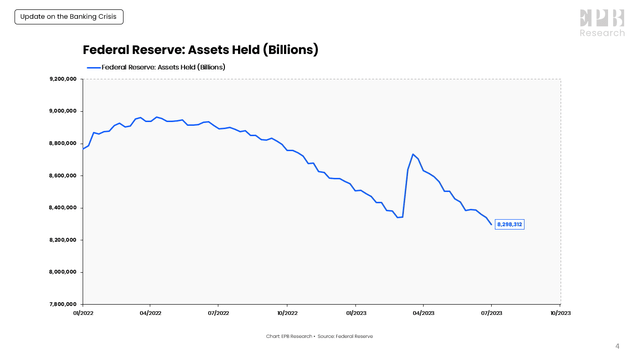
As interest rates moved higher, many people moved money out of bank deposits and into Treasury bills or money market funds to capture the higher rates of interest. As a result, total deposits in the banking system started to decline.
Federal Reserve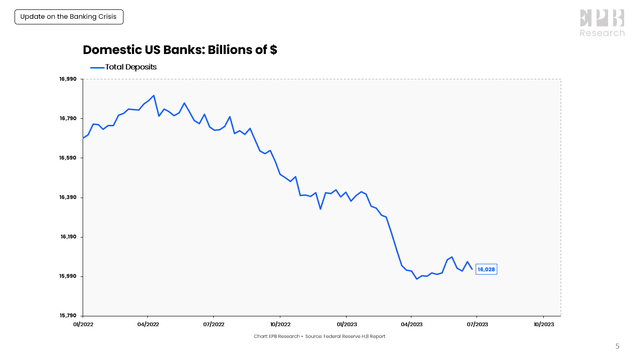
This is bad for banks because these deposits are a very low cost of funds for banks. As the deposits continued to flee, banks had to start replacing this low-cost of funding with higher-cost borrowings from the Federal Home Loan Bank and the Federal Reserve.
During the intense bank run in March, borrowings spiked as banks had to plug the hole that was developing on the liability side of their balance sheet.
Federal Reserve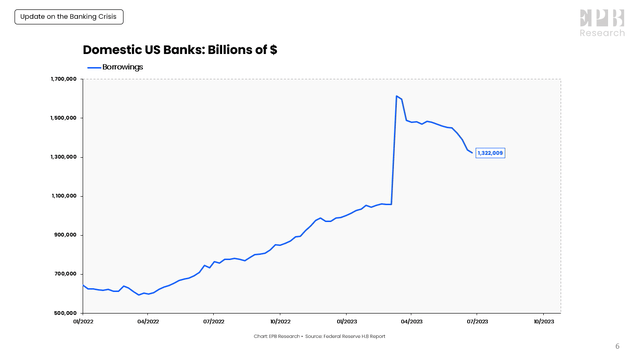
The problem is that the deposits only cost the bank 1% or sometimes even less, and these borrowings can cost upwards of 5%.
So the bank is replacing 1% yielding funds with 5% yielding funds at a time when the Baa corporate rate, or the rate that banks can reliably earn on their loan portfolio, is yielding less than 6%.
Federal Reserve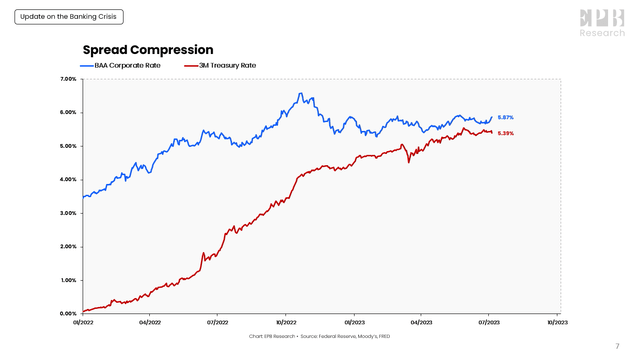
So if banks have to replace low-cost deposits with high-cost borrowings, they cannot make any money as there is no spread.
This chart clearly shows the spread available for banks to capture between the marginal cost of funds and the average yield in the economy. Banks can find a few assets that yield more than 6%, but unless banks want to take on more than average credit risk, it will be hard to reprice total assets much higher than 6%.
Under these conditions, banks have little interest in growing their balance sheet and extending new credit because it’s structurally unprofitable to do so without taking higher levels of risk at a time when recessionary conditions are building.
The primary source of funding for banks are deposits which can be large-time deposits like CDs or what are called other deposits. Other deposits are the largest and most important component, and other deposits in the banking system continue to drop, falling more than 1 trillion dollars since the start of 2022.
Federal Reserve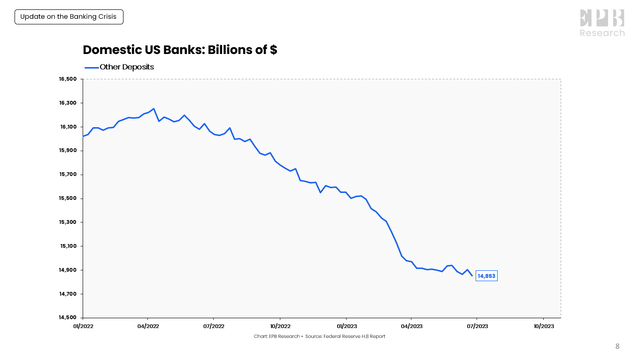
As deposits leave the banking system, banks either have to replace that funding with higher-cost sources of funds or reduce assets.
Banks responded by shedding securities like Treasury bonds and Mortgage bonds before they stopped making new loans. This is exactly what happens first in every banking squeeze. Securities are more liquid and are lower-yielding than loans, so securities are always the first to go.
Federal Reserve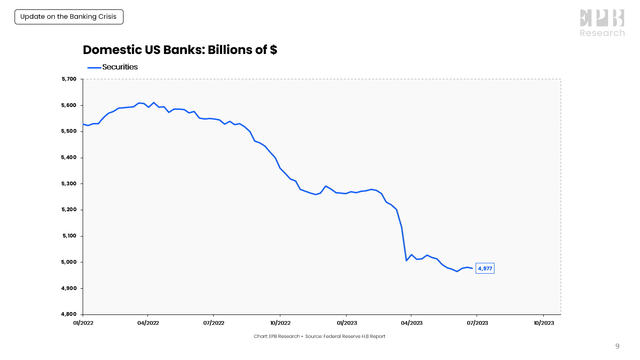
After banks have already reduced holdings of securities, next comes the loans. This is why bank lending is a lagging indicator. Think about how many steps had to occur before banks start reducing their loan portfolio.
Federal Reserve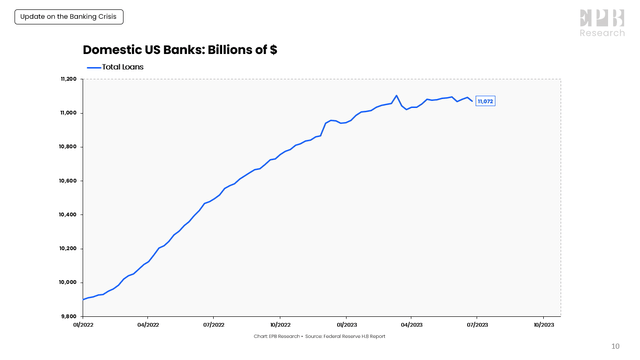
First, the Fed tightens monetary policy, then deposits start to decline, next banks shed securities, and then the loan book starts to decline, and we can see the very early innings of a pullback in aggregate bank lending following the decline in deposits and securities.
Again if we look at the growth rate, the story becomes more clear. Banks were extending new loans at a pace of 12% in the middle of 2022, and that has slowed to a pace of 3% over the last six months, and it is still declining.
Federal Reserve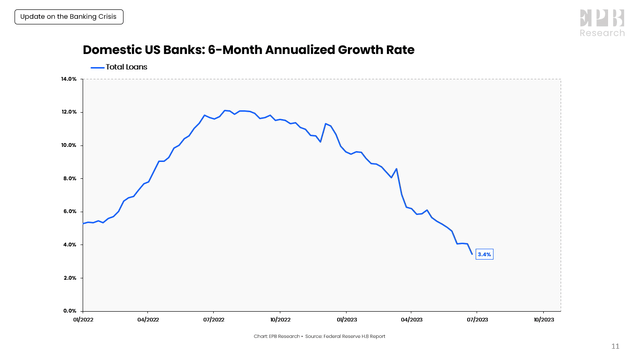
Within the broad category of loans, we see banks pulling back first on Business Commercial and Industrial loans. C&I loan growth started to contract, falling sharply after the SVB failure from 5% into negative territory.
Federal Reserve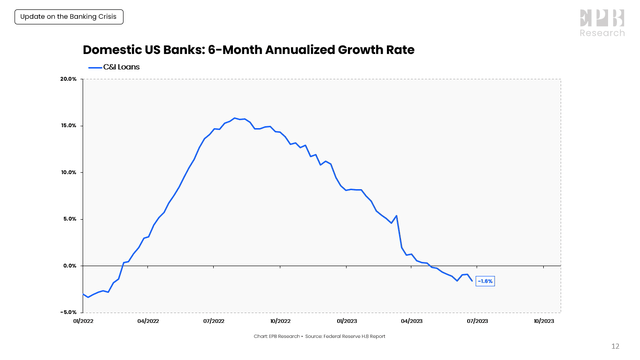
Banks have pulled back credit from businesses, and this will undoubtedly cause a depressing effect on overall economic activity.
Real estate loans are the biggest category for banks, and smaller banks in particular. Real estate loans were growing at more than 12% at the start of 2023 and have cooled to 5% in the aftermath of the crisis.
Federal Reserve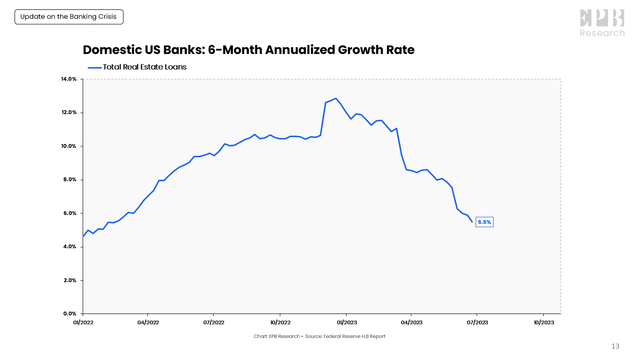
In particular, banks are starting to rapidly slow the rate of commercial real estate loans, falling from 13% in mid-march to 6% as of the of end of June.
Federal Reserve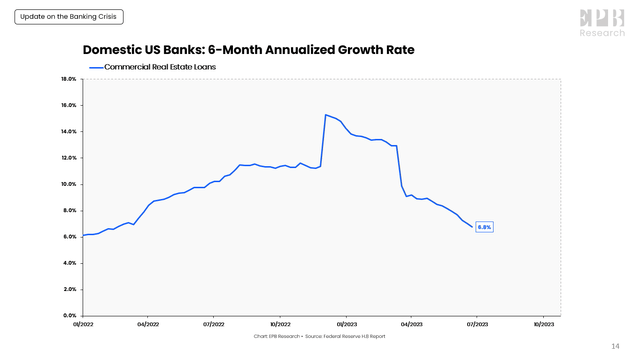
At EPB Research, we focus specifically on the sequence of economic events as the sequence is what gives the business cycle it’s predictable rhythm and is what’s the same from cycle to cycle. The leads and lags vary and other variables are constantly changing, but the sequence remains the same.
First, the monetary tightening caused a contraction in deposits. This contraction in deposits forced banks to reduce assets or replace the funding with higher-cost borrowings. As banks first pulled back on securities, bank credit moved into contraction.
Federal Reserve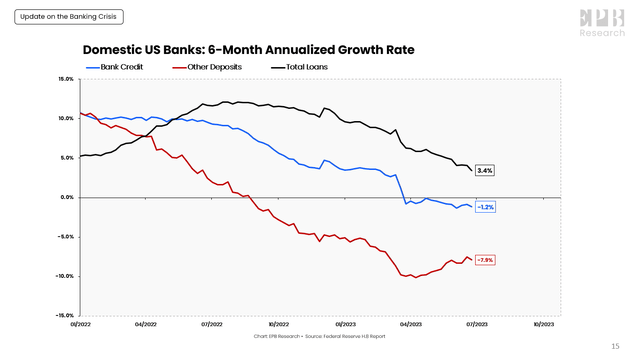
Only after a contraction in deposits and then securities do you see banks start to pull back on lending, which is why bank loans are a lagging economic indicator. But since we know the sequence always remains the same, we can have a lot of confidence that if this trend persists, banks will start outright contracting their loan portfolio, which means the real economy will be starved of new credit.
First, banks pulled back on the quicker C&I business loans, and now we’re starting to see the slow decline in real estate-related loans, most specifically commercial real estate.
Federal Reserve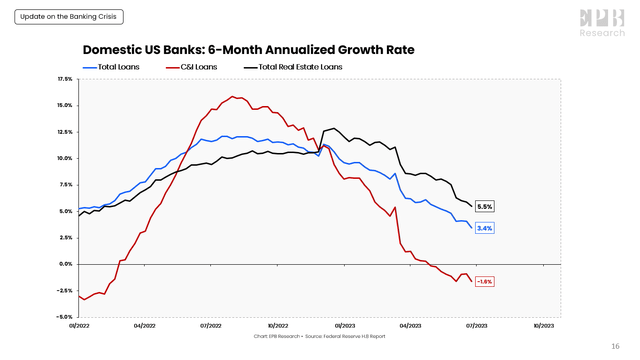
As long as the outflow of deposits continues, banks will have to reduce their assets or find more costly borrowings to plug the balance sheet hole; otherwise, they become increasingly leveraged.
Federal Reserve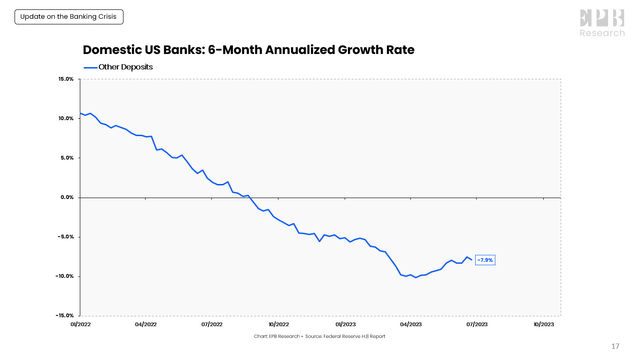
If banks have to replace low-cost sources of funding with a new source that is yielding more than 5%, like the new Bank-Term-Funding-Program, then it’s basically impossible to operate profitably since the rate a bank can earn on average credit risk is less than 6%, there’s not enough spread for the bank to make a profit.
Federal Reserve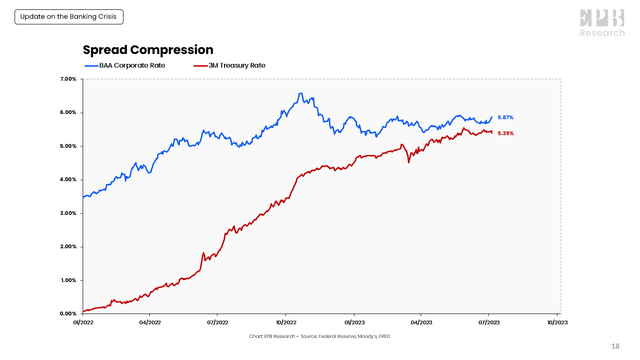
So as the Fed continues to raise interest rates, deposits will keep contracting and force banks to reduce assets and contract bank credit. Lastly, the loan portfolio will shrink, which is something that normally happens at the end of recessionary periods as bank lending is the last to move, a lagging indicator.
Federal Reserve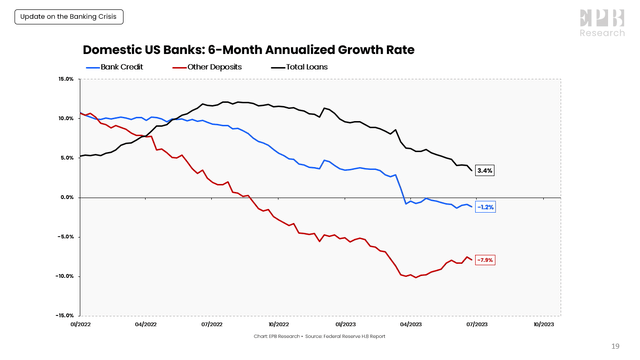
It will be increasingly difficult for banks as a collective to grow their balance sheets and extend new credit, which makes it very challenging for the overall economy to avoid contraction.
Read the full article here


