June’s Headline CPI rate came in at +0.2% (+0.18% unrounded), slightly lighter than expected, up from +0.1% in May’s reading. Core CPI verified at up 0.2% (0.158% unrounded) compared to the +0.3% consensus. It was the weakest monthly Core CPI rate since February 2021.
On a year-on-year basis, Headline CPI was up an even 3.0%, better than the 3.1% expectation and the lowest annual jump in more than two years. What the bulls really liked to see was the year-over-year Core CPI Rate that registered 4.8%, significantly less than the 5.0% economist consensus figure and a steep drop off from 5.3% back in May. It was the lowest annual change in Core CPI since October 2021.
U.S. Real Average Weekly Earnings Y/Y came in up 0.6% while U.S. Real Average Hourly Earnings jumped a full percentage point, from month-ago levels from 0.2% to 1.2%.
June CPI: Cooler Than Expected Inflation Trends. Stocks, Bonds, Commodities Rally, Dollar Drops
Bloomberg, Christian Fromhertz
U.S. Headline CPI Rate Continues Its Monthly Decline Trend
Trading Economics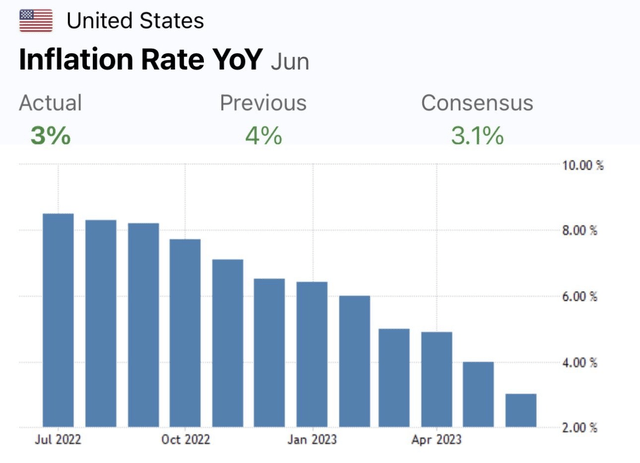
Stocks, particularly those in the tech space, jumped following the soft inflation report, and the US Dollar Index (DXY) dropped to fresh multi-month lows. The bond market, which I’ll focus on later, caught a significant bid. The rate on the 2-year Treasury note (US2Y) plunged about 8 basis points to 4.78% following the 8:30 a.m. ET release. As of 9 a.m. ET, the 10-year Treasury note rate (US10Y) was a few basis points lower to 4.86% while the long bond’s rate held at 4.0%. Chances for a pair of Fed interest rate hikes dropped to just a one-in-four chance, according to the CME FedWatch Tool.
Heading into the print, analysts at JPMorgan forecasted a solid equity rally following a sanguine inflation report. We’ll see if a gain near 0.75% plays out, but that’s about where futures stood before the opening bell.
Stocks Expected To Rally Following Wednesday’s Modest June CPI Figures
JPMorgan, Bloomberg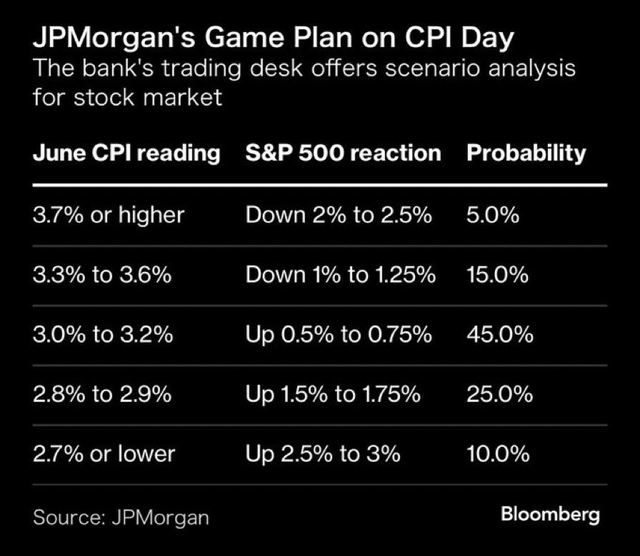
What has been fascinating to watch transpire in recent weeks is the decline in the U.S. dollar while Treasury yields have risen modestly. Typically, as pointed out by Matthew Miskin, when the greenback drops, rates often follow suit. In my view, we may see Treasury prices find their footing as downside bond price action wanes with continuing favorable trends in domestic inflation.
Dollar’s Decline May Portend A Move Lower In Treasury Rates
FactSet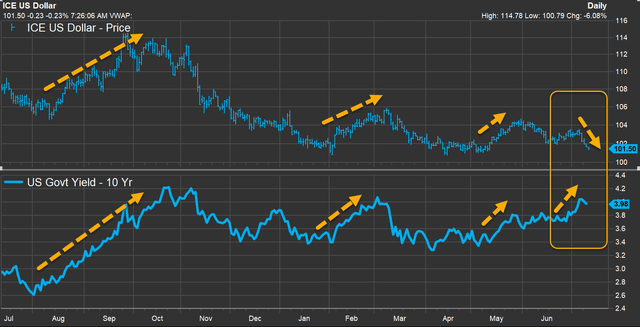
Let’s focus on the aggregate US bond market via the SPDR® Portfolio Aggregate Bond ETF (NYSEARCA:SPAB). This is a popular fund for investors and advisors looking to get exposure to the total domestic fixed-income market.
According to SSGA Funds, SPAB seeks to offer comprehensive exposure to U.S. dollar-denominated investment-grade bonds including government bonds, corporate bonds, mortgage pass-through securities, commercial mortgage-backed securities, and asset-backed securities. The index the exchange-traded fund (“ETF”) tracks is market cap weighted and reconstituted on the last business day of the month.
The fund features an extremely low annual expense ratio (cheapest among its peers) of just three basis points and features a yield to maturity of 4.92% as of July 11, 2023. Key for bond investors concerned about interest rate risk, the portfolio’s weighted average option-adjusted duration is 6.27 years – that means for every 1% rise in market interest rates, you should expect SPAB to decline in price by approximately 6.3%. Holding nearly 7,000 positions, it is a high-quality and diversified portfolio of fixed-income securities.
What’s ideal about SPAB and the US Aggregate Bond Market (AGG) today is that investors can reasonably expect to outpace inflation by owning SPAB. Considering five to 10-year inflation expectations are under 2.5%, the fund’s “real” yield is near 2.7%.
US Bond Market Yield & Duration Situations
WisdomTree Funds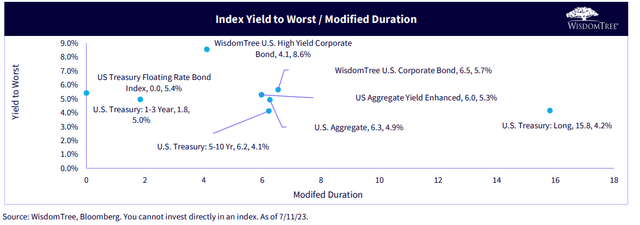
Inflation Breakeven Rates Calm Near 2.2% Over the Next 10 Years
St. Louis Federal Reserve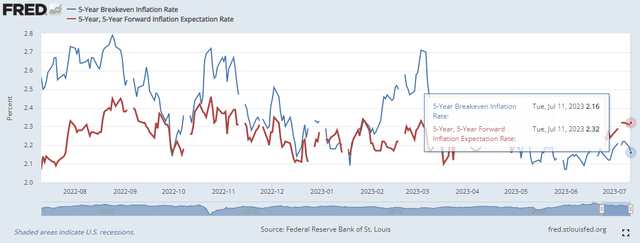
The Technical Take
With a very low cost and strong tradability readings, the SPAB chart is somewhat lackluster right now. Notice in the graph below that SPAB is in a stubborn trading range between $24.50 the $26. I like that the ETF held support on its latest test earlier this week, but the bond bulls want to see SPAB settle above $26 on a closing basis.
Also, a new high in the RSI momentum reading at the top of the graph would help confirm an upside move in price. What’s bullish, though, is that there’s little volume by price from $26 up to the old 2020 through 2021 range lows just under $28, so a bullish breakout could result in material future price appreciation. A breakdown under $24.50, however, would be quite bearish.
SPAB: Share Rise Post CPI, Likely To Test Upper End Of its Range
Stockcharts.com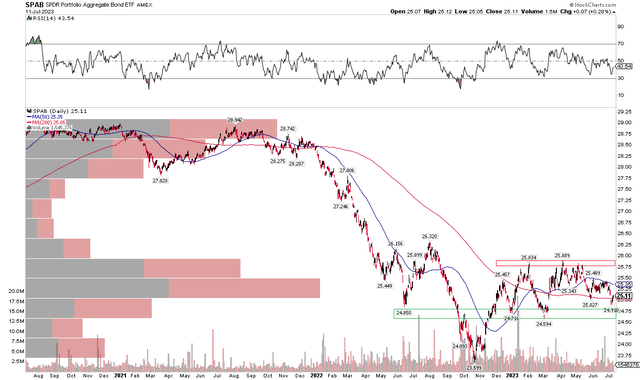
While the CPI print is always important, it has become less significant as 2023 has progressed. I put some hard data and performance numbers to that conjecture last night on Seeking Alpha. Later today (July 12), five Fed members will speak on assorted topics, so volatility is not done for the day. And more uncertainty lies at the July 26 Fed rate decision. Already today, Federal Reserve member Tom Barkin expressed concerns about persistently high inflation, emphasizing that while demand appears to be stabilizing, he remains cautious about its impact on inflation. Barkin stated that further evidence is needed to confirm whether the stabilization in demand will effectively translate into lower inflation.
The Bottom Line
I have a buy rating on SPDR® Portfolio Aggregate Bond ETF. I like the fund’s low cost and high liquidity. Moreover, with easily positive real yields today, long-term investors concerned about taking on too much stock market risk should consider making SPAB a portion of their portfolios. As inflation continues to ebb, risks should moderate in the fixed-income markets.
Read the full article here


