In our last article, “Leading Indicators Are Deteriorating; It’s Time To Sell The Indices”, we did a deep dive into the state of the global economy, attempting to suss out where global GDP was headed and what the implications might be for your money. You can read the full article here.
In short, we ended up advocating for a bearish view in equities overall, as a result of poor leading economic indicator readings in the most important economic regions.
Combine that outlook with a historically ‘expensive’ valuation environment, and it’s tough to make a bull case for new stock buyers at these prices.
How To Find Opportunities
However, while we did end up covering the macro environment in detail, we also talked a bit more about the importance of using a top-down view to effectively allocate capital in modern markets:
When it comes to managing a portfolio of assets, some investors approach things from the “bottom up”, analyzing individual stocks with a one-at-a-time approach.
However, if you’re anything like us, you may find it difficult to operate in the financial markets like this. With over 4,000 publicly listed equities in the United States alone, it’s impossible to cover them all. Even more importantly, being a bottom-up investor isn’t as effective as it once was.
As trillions have been sucked into indexing and passive investing, there has been a massive shift in the way markets work.
Before, individual companies each had robust markets for their stock, and their stock alone.
Now, many stocks are very thinly traded. Fund flows, which used to be derived from the performance of underlying stocks, are now the driver of a majority of trades in most stocks on most days.
In short, funds are deciding how they feel about the market as a whole, and then these trades trickle down to the underlying stocks which then move in the direction of this view.
It stands to reason that many single stocks are potentially mispriced as a result of the dominance of market-wide flows. However, this doesn’t mean that a company is going to be ‘recognized’ by the market.
Approaching the market from the top down is key to quickly understanding where to begin digging for gold, and what companies are poised to benefit from the macro.
In other words, using a top-down approach is key for getting the direction of the market (and individual stocks!) right, but also for figuring out which stocks are most likely to make big moves on the back of high-level decisions from big allocators.
Today, we’re going to explore how to find amazing trade ideas using a top-down framework.
Sector Analysis
To kick off this process of finding well-positioned stocks, one needs to first begin with some broader sector & industry analysis.
As we mentioned before, we currently have a bearish view on GDP growth, which means that we think GDP is likely going to contract over the coming 6-8 months.
As a result, conventional trading wisdom argues that the most optimal move is to be long stocks in defensive sectors and short stocks in cyclical sectors.
Typically, here’s how these definitions are broken down:
PropNotes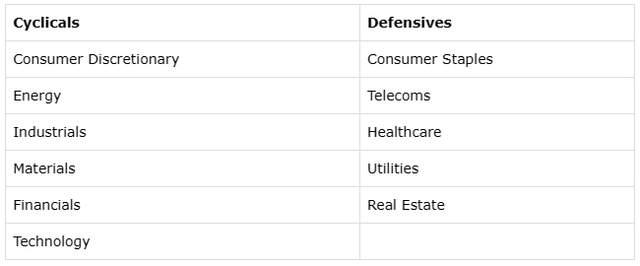
While the table above is a great starting point, it isn’t a perfect way of separating out companies that are sensitive to the business cycle.
There will be telecom stocks whose earnings are highly sensitive to GDP, and financial companies whose earnings are completely uncorrelated with the broader business environment. On the whole, though, it’s a great starting point.
It really comes down to the elasticity of a company’s product. For example, Lululemon (LULU) yoga pants are an elastic good. When you’re feeling wealthy, you’ll buy some. When you’re feeling stretched, they’re the first thing to go. This is the opposite of inelastic goods. Medications, electricity, and rent are expenses that are almost impossible to remove from a household budget.
Thus, right now, we should be looking for the best companies, in the most stable industries, who sell the most inelastic products.
Industry Analysis
It’s time to dive one layer deeper to the industry level. Here, we’ve broken down industry relative strength across cyclical and defensive industries, according to leading economic indicators / reports.
Let’s start with the cyclical industries:
PropNotes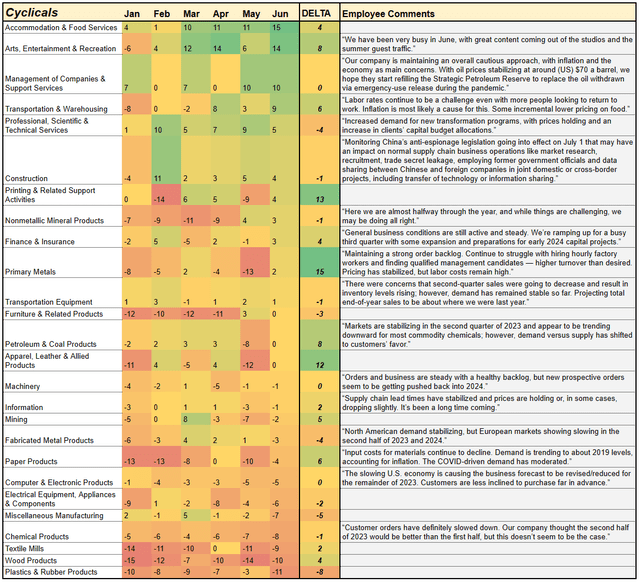
Here, you can see that right now Accommodation & Food Services (HOTL, EATZ) is poised for growth and is the most relatively strong cyclical industry.
On the other hand, Plastic & Rubber Products is set to contract, and is the weakest relative industry.
Here are the defensive industries:
PropNotes
Similar to above, Real Estate (XLRE) looks like the strongest defensive industry right now, and Agriculture looks like the weakest.
Finally, there are two industries that one could feasibly put into the “both” category:
PropNotes
As there are both cyclical and defensive retail/wholesale companies – think Nike (NKE, a cyclical business) US Foods (USFD, a defensive business) – you really need to take each of these industries on a case-by-case basis.
Then, separating the wheat from the chaff is just a matter of understanding our sector bias from before. Since GDP is set to contract, we’re looking to long defensives and short cyclicals. But which ones?
It’s best to long the defensive industries that are showing growth, and short the cyclical industries that are experiencing contraction. As GDP rolls over, the already-weak cyclical industries will provide alpha on the downside, and the steadfast, growing defensive industries will remain buttressed on the long side.
Any other allocation would be ‘dead money’, and would likely be sub-optimal:
PropNotes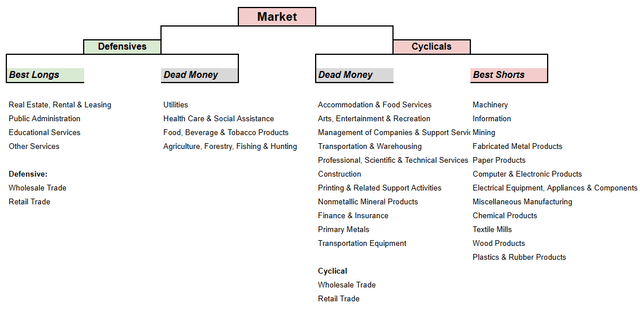
So far, we’ve broken our market view down into a simple, actionable list:
PropNotes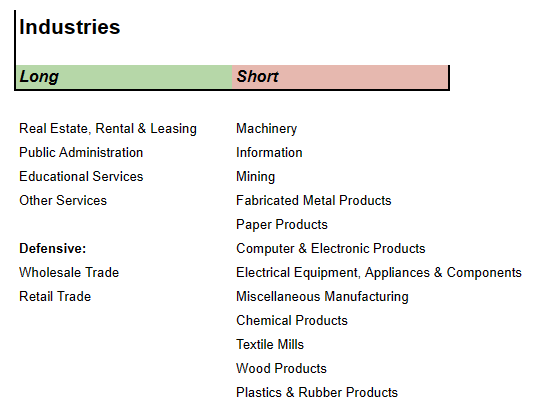
This what we meant earlier when we said, “Approaching the market from the top down is key to quickly understanding where to begin digging for gold.”
Finding The Right Companies
Great! Now we have a much better idea of where to look. The next step is finding companies that are potentially well positioned to move on the back of this leading economic data.
This is where Seeking Alpha’s Quant Rating System is extremely helpful. In short, it can cut down research time further and help us find companies that are set to outperform and underperform, even on a secular basis.
Upon searching in the following industries…
Seeking Alpha
We get the following results:
Seeking Alpha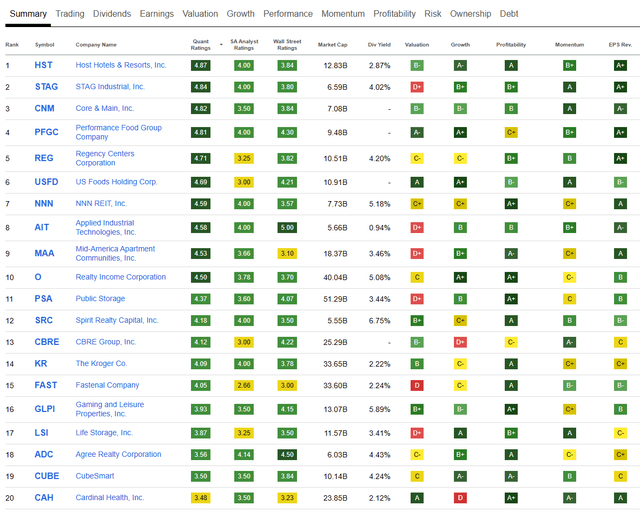
According to Seeking Alpha, these are the strongest potential stocks in the industries we’re looking at getting long. Plotted on a relative rotation basis vs. The S&P 500, we get the following visual:
StockCharts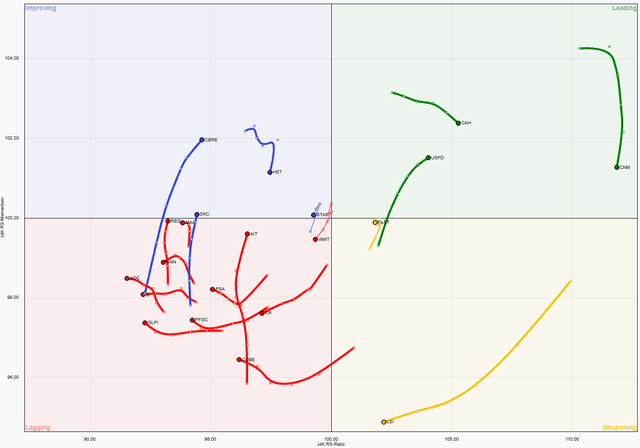
There are a few good looking options here, like CBRE and CAH.
However, the best-looking stock here is Spirit Realty Capital (SRC), which Seeking Alpha’s Quant system rates highly, is just now moving from the lagging to improving quadrant above, and is also a decent looking bargain with growing revenue and cash flow, at an attractive 13x FCF:
TradingView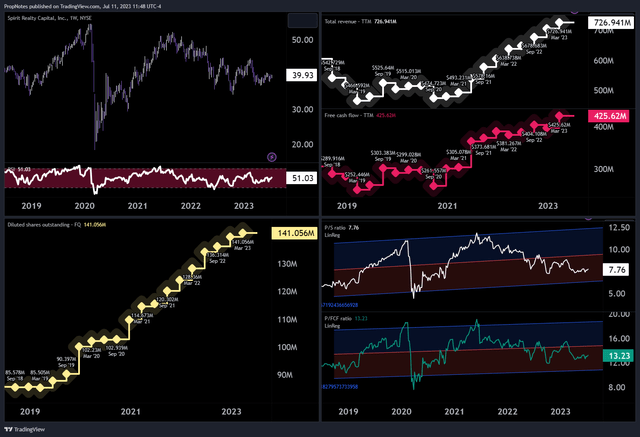
Sure, diluted share count is growing, but it seems like a very well positioned stock given all of the other criteria we’ve laid out.
On the other side of the market, let’s look for a short idea.
Upon searching for the following industries…
Seeking Alpha
We get the following results:
Seeking Alpha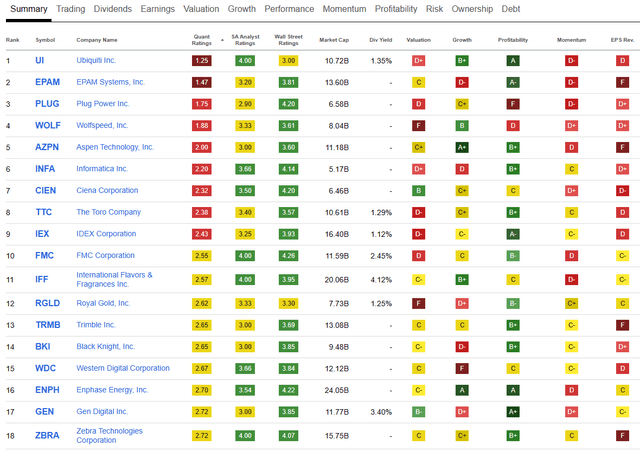
According to Seeking Alpha, these are the weakest potential stocks in the industries we’re looking at getting short in. Plotted on a relative rotation basis vs. The S&P 500, we get the following spread:
StockCharts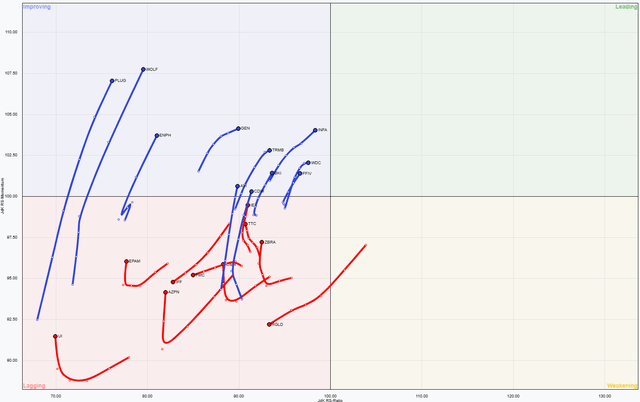
Some good-looking options here include IFF and RGLD.
However, the best looking short here, in our opinion, is FMC Corporation (FMC).
In addition to sporting a “lagging” moniker on the plot above, the company retains a 2.54 SA quant score which barely puts it above a “sell”, along with shrinking cash flows and an expensive 61x FCF multiple:
TradingView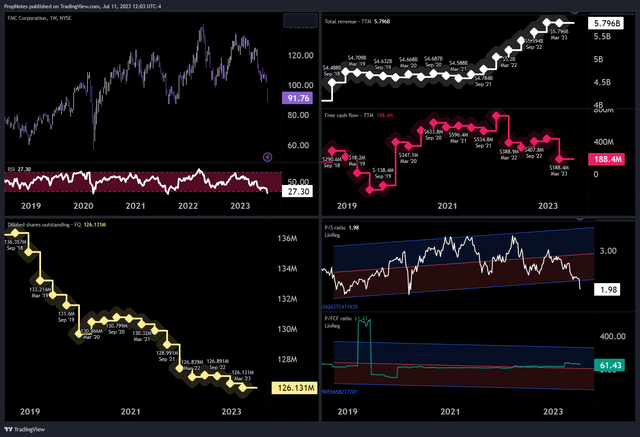
The Pair Trade
While it’s entirely possible that you could use the framework we have laid out here to only select long positions or short positions on an outright basis, something powerful happens when you combine stocks to create a single, themed position: hedging.
If position sizes are adjusted for equity beta, going long SRC and short FMC at the same time in tandem actually completely mitigates market risk and exposes an investor to stock-specific (and, to a lesser extent, industry) risk.
Considering that we expect SRC to perform well and FMC to perform poorly in the coming economic environment, this trade seems like an excellent expression of our global views. This is doubly true, when combined with rotational and financial analysis of each company.
The cherry on top of this is that SRC currently yields about 6.75% in dividends, while FMC yields only 2.5%. This means that the position has a positive carry of 4.25%, or 25 basis points more than what you’re getting for a 10-year treasury. Not bad!
Risk Management
The final piece here in this potential trade is risk management. Just because we’ve identified trends that we think should make us money over the next 6 months doesn’t mean that the time is right to strike.
Thankfully, it appears technicals are cooperating with this idea:
TradingView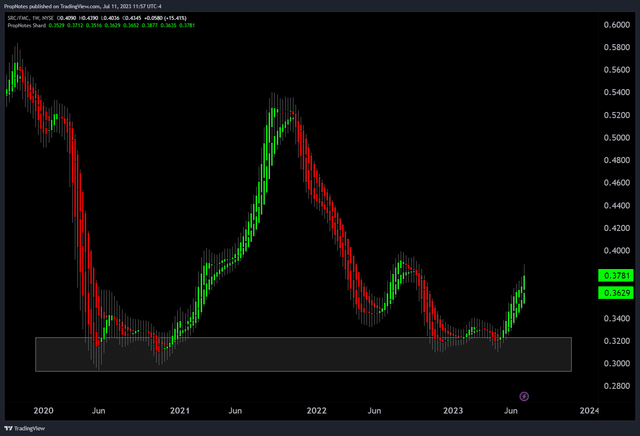
As you can see above, we’ve plotted the performance of SRC vs. FMC over the last few years, and there are 2 important things of note.
First, the trend is positive, as this spread trade has performed in our favor over the last few weeks. This is a sign that the market is seeing what we are seeing, and the time is right to strike.
Second, the price of this pair has ranged from 0.31c to 0.56c over the last few years. It can’t seem to crack 0.31 for whatever reason, and thus buying the pair off of these lows seems reasonable from a technical analysis point of view.
Risking this themed position to June lows seems like the best course of action from a risk management standpoint, if someone reading this were thinking about putting this trade on.
Summary
Ultimately, we think SRC is well positioned to outperform the market, and FMC is well positioned to underperform the market, given the top-down analysis we’ve presented, combined with the single-stock differences in cash flow growth, valuation, and more that we looked at.
Taking this pair trade and risking to the low 0.30s seems like a solid risk-reward for the coming macro environment.
While we’re highlighting SRC and FMC today, this process can be repeated at any time in the economic cycle to find attractive long and short ideas.
Ultimately, we hope this was a helpful article in the broader sense, and that you learned a thing or two.
Feel free to ask questions in the comments.
Cheers!
Read the full article here


