By Jharonne Martis
It’s Amazon Prime Week (AMZN), and every year retailers ride the coattails of Prime Week with their own sales.
During the last earnings season, most retailers agreed that consumers are cautious and are trading down. Therefore, this Prime Week, retailers are betting that heavy promotions will entice shoppers to open up their wallets, especially since consumers have become value oriented. There is no doubt consumers will be doing online price comparisons this week and other retailers are hoping to capitalize on this phenomenon by offering steep discounts.
Rising online discounts
Amazon will offer these deals primarily online and only to its Prime subscribers, whereas Target (TGT), Best Buy (BBY), Walmart (WMT), and others will offer the same deals in-store and online. Still, price comparisons will happen online. Target and Walmart already announced their sales on the same days as Prime. In fact, U.S. mall stores online have become significantly more promotional – Target, for instance, has become more promotional during Prime Week this year, hoping to lure more shoppers. Increasing price competition is already evident in the rising online discounting data among U.S. retailers (Exhibit 1).
Exhibit 1: Average Discount Penetration for U.S. Retailers: 2019-2023
Centric Pricing, formerly StyleSage Co.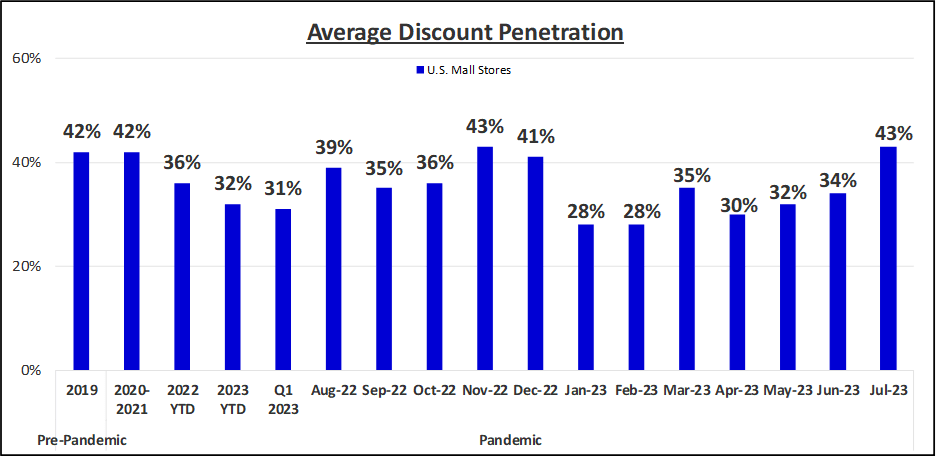
The discount penetration (how much of the assortment is on sale) in July has jumped significantly to its highest level since Black Friday 2022. This is the opposite of what we saw in the first quarter of this year when retailers were less promotional.
In July, 43% of U.S. retail online merchandise has gone on sale (Exhibit 1). LSEG discovered this in collaboration with Centric Pricing, formerly StyleSage, which analyzes retailers, brands, online trends, and products across the globe.
While still early in the month, the July discount penetration of 43% rose well above the first quarter 2023 average of 31%, as retailers try to piggyback on Amazon’s Prime Day deals to build customer loyalty and entice shoppers to spend on discretionary items. Demand for discretionary items had been weaker than usual this year as consumers trade down, and preferences have changed.
Conversely, last year the most sought-after items during Prime Week included discretionary items such as outerwear and jackets (Exhibit 2). Given the economic climate and consumers’ appetite for staples, it will be interesting to see if this pattern holds.
Exhibit 2: Last year’s top sold-out categories across Prime Week 2022
Top Sold Out Categories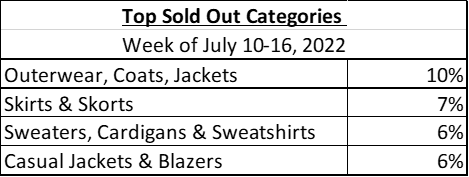
Meanwhile, the average percent discount in July so far has remained mostly consistent with Q2 levels at 38%. This is slightly below the 2023 average of 39%, but this average could still shift over the remainder of the month (Exhibit 3).
Exhibit 3: Average Promotional Discount for U.S. Retailers: 2019-2023
Centric Pricing, formerly StyleSage Co.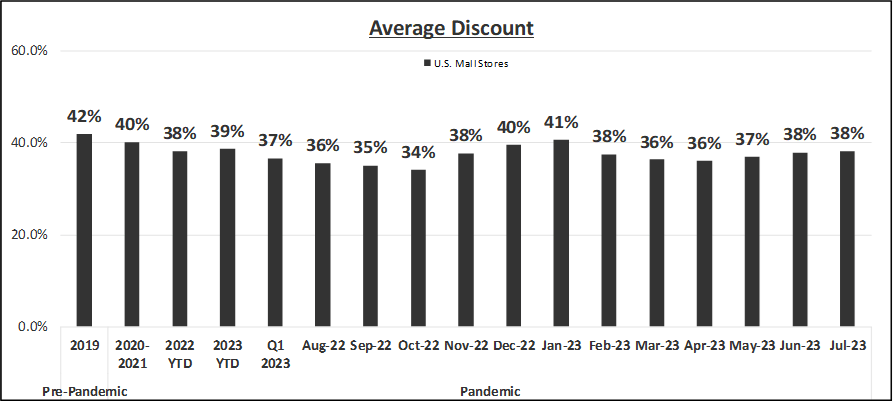
Although Amazon initiated Prime Day, other retailers like Target introduced Cycle Week to take on Prime Day promotions. This event is exclusively offered to Target’s clients who are part of its loyalty program. Unlike Walmart and Amazon where shoppers have to pay to participate in the membership, Target’s loyalty program is free.
Accordingly, Target is remaining “competitive with the market” by following a similar pattern to others in the industry on Prime Week. Target has been ramping up its assortment for Prime Day; its discount penetration of 56% is slightly above its peers’ average of 53% (Exhibit 4).
Right now, there’s no question that guests are seeking deals. The opportunity to balance their budget by finding deals is very visible. As I just talked about, the way that we’re continuing to evolve our proposition is to make sure that the deals that we do offer are certainly competitive with the market, but that they’re increasingly more personalized. And as has been said a couple of times now, the inventory position that we’re in right now gives us the ability to compete with the market but not chase the market down.” (Source: Target Q1 2023 Earnings Call)
Exhibit 4: Average Discount Penetration on Prime Week: 2019-2023
Centric Pricing, formerly StyleSage Co.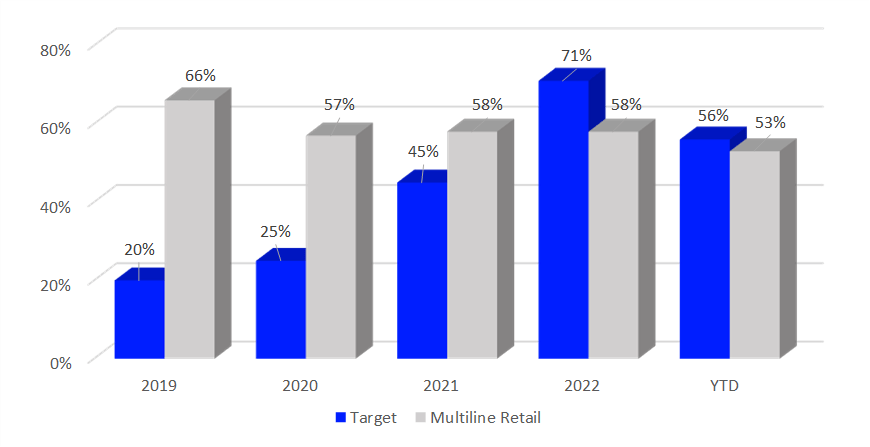
Meanwhile, Target’s average percent discount has come down compared to last year for Prime Week and is below its peers’ level (Exhibit 5). This is in line with its commentary on the earnings call suggesting it is not “chasing the market down.”
Exhibit 5: Average Promotional Discount on Prime Week: 2019-2023
Centric Pricing, formerly StyleSage Co.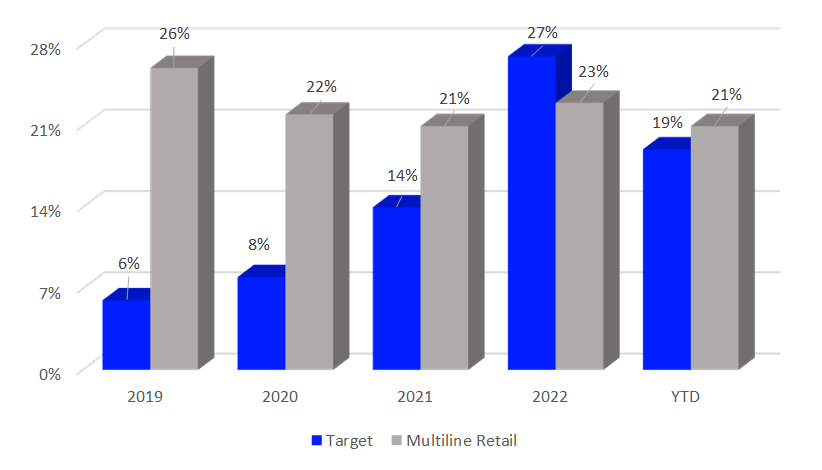
E-commerce growth comparison
Amazon Prime Day takes place this year July 11-12, the same week compared to last year. This year’s Prime Day sales will affect Amazon’s Q3 2023 revenue, which is estimated to grow 3.6% to $55.402 million, and are on track to be stronger than the previous two years (Exhibit 6). In the past, third-party sellers were not allowed to participate in Amazon Prime events. This year, however, Amazon is allowing them to participate. Amazon’s Fulfillment Centers are now operating more efficiently post-pandemic, just in time for Prime Day as inventory levels are lean.
Exhibit 6: Amazon Prime Day Revenue in USD Millions: 2019 Actual-2023 Estimate
LSEG I/B/E/S
In terms of year-over-year growth, Walmart is expected to see the biggest gain online for the fiscal quarter which includes Prime Week 2023. The discounter is expected to post a 17.5% e-commerce growth for Q2 2023 (Exhibit 7).
Exhibit 7: Online Growth Estimate: Quarter including Prime Week
LSEG I/B/E/S
Analysts polled by LSEG are already bullish on Amazon’s performance for Prime Day. The consensus for Amazon’s Q3 2023 EPS, including Prime sales, is $0.40. However, there’s a five-star rated analyst with a very accurate rating that published a Bold Estimate, which is different (in this case higher) than the consensus estimate. This suggests that it’s likely that Amazon will beat earnings and post a positive surprise.
Amazon also scores in the top quartile with the StarMine Analysts Revisions Model (ARM) with a score of 85 out of a possible score of 100, placing it in the top quartile. This StarMine model suggests that analysts polled by LSEG are likely to revise earnings estimates upward for Amazon. StarMine uses I/B/E/S estimates, fundamentals, and other LSEG content to provide robust alpha-generating predictive analytics and quant models.
The battle for subscriptions
During the pandemic, shoppers flocked online as brick-and-mortar stores remained closed. Giant retailers including Amazon and Walmart saw a spike in membership as shoppers justified the annual fee. Since then, consumers’ shopping behavior has changed dramatically.
Recently, Walmart raised its full-year guidance, as more consumers continue to gravitate towards everyday values and become loyal shoppers.
We continue to gain market share in the grocery category, including with higher income and younger shoppers, and we saw good growth in membership income in both businesses. At Sam’s Club U.S., member count and Plus member penetration hit all-time highs in the quarter. Our growth is now being driven by convenience in addition to price.” (Source: Walmart Q1 2023 Earnings Call)
Thus, Walmart continues to gain more subscribers on top of the enormous gain during the pandemic.
In the last fiscal quarter, Costco (COST) reported an impressive renewal rate of 92.6% in the U.S. and Canada. Despite these high renewal rates, Costco refuses to raise its prices in this economic environment.
Still, in terms of revenue in dollars, Amazon still brings in the highest amount in U.S. dollars (Exhibit 8). Many shoppers couldn’t justify Amazon’s annual fee until the pandemic when they started to buy everything online and started having Whole Foods deliver for the first time. They also started streaming Prime TV movies and binge-watching series. As a result, back then, Amazon saw a whopping 28.7% gain in subscription services revenue in the midst of the pandemic (Q2 2020).
The pandemic pulled forward a lot of demand that, once satisfied, started showing up in slower Prime membership revenue growth. In the last fiscal quarter, Amazon grew its subscription services revenue by 14.8% from the previous year to $9.657 billion. This, however, is projected to see a slowdown in growth to 9.7% in Q4 2023.
Still, in the last fiscal quarter, Amazon reported a membership revenue gain of 14.8%, followed by Costco’s 6.1% and Walmart’s 1.2% year-over-year gain (Exhibit 8). In order to attract new customers, Walmart is currently offering 50% off its annual membership – coinciding with Prime Week, making it the least expensive out of the three club memberships fees. Costco’s membership offering ranges from $60 to $120, below Amazon’s $139 membership fee.
Analysts polled by LSEG are bullish on Walmart’s ability to continue to grow its membership, and project it will grow its membership income by 3.3% at the end of this year.
Exhibit 8: Amazon, Walmart, and Costco Membership Revenue in USD Millions: 2021-2023
LSEG I/B/E/S
Back-to-school
No matter how the economy is doing, back-to-school happens every year and parents budget for it. Retailers are definitely taking advantage of Prime Week to attract those parents.
This year, retailers know they are dealing with a penny-wise consumer who is sticking with staples. This will be the first time in three years that Amazon will actually offer “subscribe-and-save” items on sale during the Prime event, i.e., ‘consumer staples’, that Amazon already knows people want. Target is using a similar approach and blasting its home page with back-to-school deals for Prime Week, and it looks like it might be paying off.
Landing on Target’s home page are back-to-school deals, as the retailer has dialed up the discounts this year. The back-to-school discount penetration (the amount of merchandise including backpacks, kid’s apparel, and footwear) has risen from 46% to 57% this year, and so has the average discount. It looks like this promotional strategy is working, as the sold-out rate of 13% is higher than last year’s 9%, so far. Please note, “sold out” includes items that went completely out of stock at any point during that period, even if they were then restocked – it is still counted as sold-out.
Exhibit 9: Target’s Back-to-School Sold out %, Discount Penetration, and Avg Discount: June/July 2022-2023
Centric Pricing, formerly StyleSage Co.
COGS/Gross profit
Last year’s inflation caused several retailers to deal with higher costs of goods sold (COGS). Since then, supply chain issues have eased compared to a year ago. Retailers are no longer dealing with the high freight and shipping expenses they did during the pandemic years. COGS have come down from those higher levels (Exhibit 10).
Moreover, retailers were less promotional during the first quarter of 2023. All these factors, in turn, helped retailers beat earnings expectations and post healthier margins in Q1 2023. Therefore, retailers are taking a bit more risk and ramping up discounts to attract shoppers in the second quarter. Currently, Amazon has the highest gross profit margin compared to Target and Walmart (Exhibit 10).
However, It’s important to note that Amazon’s businesses include e-commerce, digital advertising, and AWS, among other divisions. As a result, Amazon’s gross profit is not a reflection of just its online retail business. And, likely wouldn’t even be that high if not for the 15.6% of revenue generated from its AWS business.
Exhibit 10: COGS and Gross Profit for Q3 2019-Q4 2021 Estimates
LSEG I/B/E/S
To gain a better understanding of Amazon’s profitability, we turn to the StarMine Earnings Quality (EQ) Model. According to the StarMine EQ Model, Amazon scores 16 out of a possible 100. Placing it in the bottom quartile suggests that earnings might not be derived from sustainable sources. The company’s operating efficiency component suggests that Amazon could use some help in this area.
Amazon’s operating profit margins have been declining over the past two years. Its profit margin of 2.5% is below the multiline retail industry of 8.1%. It likely wouldn’t even be that high if not for the 30% margins at AWS. Our research shows that companies with low returns tend to have a lower probability of sustaining earnings in the future.
Exhibit 11: Amazon Operating Profit Margin
Workspace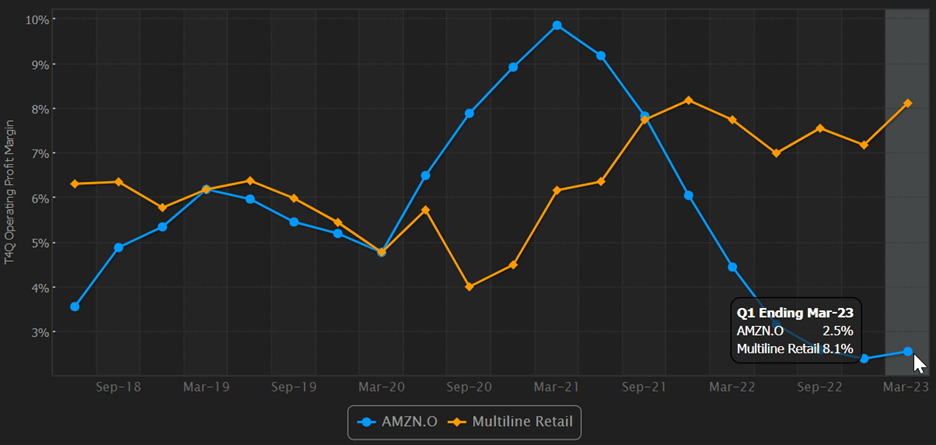
As an equity investment, Amazon’s stock price looks a little expensive. After adjusting long-term growth (LTG) estimates for optimism bias, the StarMine Intrinsic Value (IV), which adjusts for the optimism bias often found in analyst estimates for faster-growing companies and estimates well into the future, projects a 5-year CAGR of 18.1%.
That’s well above the industry median of 10.5% and Amazon’s peer median of 7.0%. Although projected to grow faster than its industry and peers, the market expects Amazon to grow faster still. At $129.78 (the last closing price as of this writing), Amazon’s Market Implied Growth is 40.7%. This number is intended to represent current market expectations – how much growth is currently priced in. Amazon is a high-expectations stock. [Note, the industry growth is 10.5%, not 40.7%] On a relative valuation basis, Amazon’s stock isn’t cheap either, with an F12M EV/EBITDA. While the stock took a plunge for being a pandemic darling, it’s still up 55% YTD.
Research has shown that sell-side analyst estimates include significant systematic errors and biases. Our StarMine Intrinsic Valuation (IV) model has identified and systematically removed three forms of analyst error and bias to improve the accuracy of longer-term estimates and enhance their ranking and sorting abilities.
Second-quarter retail earnings forecast
Looking forward to the second quarter of 2023, our LSEG retail earnings data show that consumers are spending most of their money on household products and staples. Moreover, not all shoppers might be eyeing discretionary items this quarter. And instead of buying apparel and general merchandise, consumers are prioritizing their spending on travel and eating out again this year (Exhibit 12).
The LSEG U.S. Retail and Restaurant Q2 earnings index, which tracks changes in the growth rate of earnings within the sector, is expected to show a 2.5% growth over last year’s levels. Our metrics show that six of ten consumer-related industries have turned negative (Exhibit 12). Of these industries, tracked by LSEG, the Hotels, Restaurant & Leisure sector is headed for one of the highest earnings growth rates in the first quarter, recording a 2.9% gain over last year’s robust growth.
This suggests that it continues to be one of the strongest performing sectors since last year as consumers’ preferences have changed towards services. Making up for lost time during the pandemic, people are traveling again, staying at hotels, and eating out.
Exhibit 12: Retail Earnings Growth Rates: Q2 2023
LSEG I/B/E/S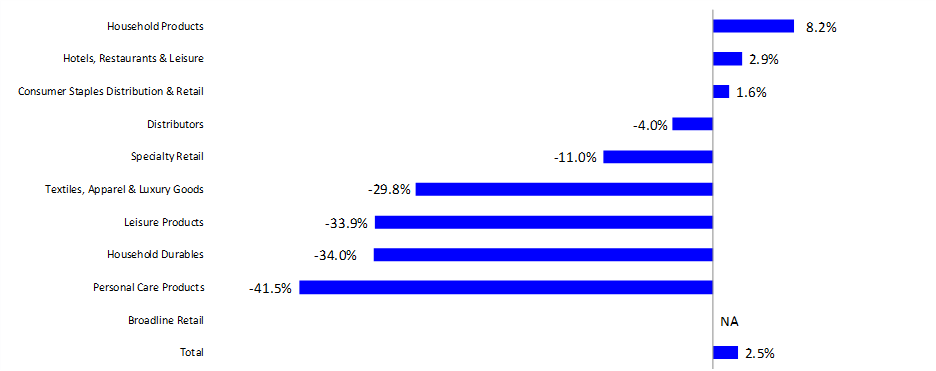
Original Post
Editor’s Note: The summary bullets for this article were chosen by Seeking Alpha editors.
Read the full article here


