Thesis
abrdn Bloomberg All Commodity Strategy K-1 Free ETF (NYSEARCA:BCI) is a big fund that offers exposure to commodity markets with a high trading volume and low expense ratio. It’s also efficient in tracking its benchmark. But because I can find multiple better options for my own purposes, I wouldn’t invest in it right now.
By comparing it to a variety of index-tracking commodity ETFs, as well as actively managed ones, you may discover this is the case too. Below, I will make such comparisons and point you to some alternatives that have either delivered superior risk-adjusted returns or have proved much more loosely correlated to the market.
What does BCI do?
BCI is an index-tracking commodity ETF issued by abrdn ETFs Advisors LLC on 03/30/2017 and managed by the same and Vident Investment Advisory, LLC. Its assets under management are $910.13 million right now.
The ETF uses a representative sampling technique in tracking the performance of the Bloomberg Commodity Index Total Return. This index currently consists of 24 futures contracts on commodities, such as aluminum, coffee, gold, copper, cotton, crude oil, corn, and more (totaling 22 commodities). The criteria the index uses to weight those positions are 1) liquidity data, 2) U.S. dollar-weighted production data, and 3) concentration limits. Right now, BCI’s biggest allocations are in gold, WTI crude oil, and Brent crude oil.
The fund uses a Cayman Islands subsidiary to invest in the futures and, therefore, it doesn’t report income using a K-1. As a result, it can also invest only up to 25% of its total assets in the subsidiary; it has allocated the rest of the assets in 3-month U.S. Treasury Bills.
Performance
Let’s begin assessing BCI’s performance by looking at how closely it tracked its index. In the last 5 years, the benchmark’s price increased by 5.36% per year and the fund returned 4.99%. On a cumulative basis, the benchmark’s price increased by 29.85% and the ETF returned 27.58%. Thus far, BCI looks efficient in its tracking.
As you may already know, researching one commodity ETF can easily lead you to a superior one. So, let us take a look at how BCI performed against some of its competitors.

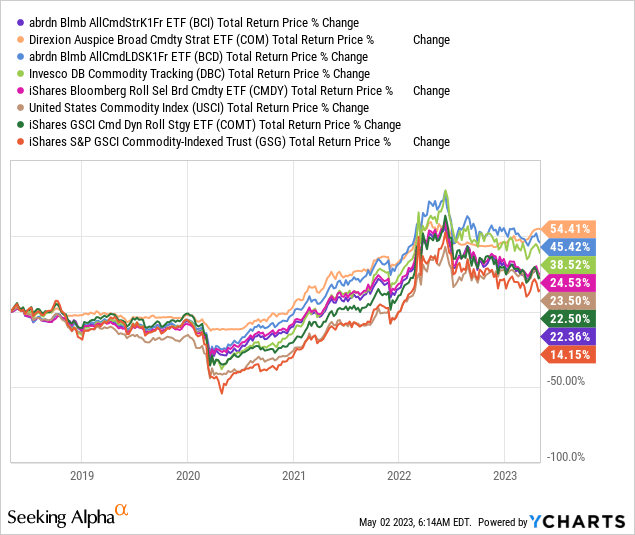
As it turns out, it seems that there are plenty of index-tracking commodity ETFs that have delivered better returns in the last 5 years. Only one fund has underperformed BCI, while there are three alternatives that have done much better. Direxion Auspice Broad Commodity Strategy ETF (COM), for example, has returned 54.41% while BCI returned 22.36% during this period. Of course, their different allocations may explain this; to be practical, though, I suggest we take a look at the risk profile of each. If there’s a case to be made for lower risk in BCI, this is a fast and easy way to find it.
| Ticker | Maximum Drawdown | Standard Deviation Annualized | Correlation (SPY) | Beta (SPY) | Sharpe |
| BCI | -30.49% | 15.72% | 0.52 | 0.43 | 0.25 |
| COM | -15.06% | 9.85% | 0.38 | 0.2 | 0.78 |
| BCD | -26.11% | 14.86% | 0.52 | 0.41 | 0.48 |
| DBC | -37.77% | 19.31% | 0.53 | 0.54 | 0.36 |
| CMDY | -28.05% | 14.41% | 0.5 | 0.38 | 0.28 |
| USCI | -42.71% | 18.02% | 0.45 | 0.43 | 0.24 |
| COMT | -36.02% | 18.80% | 0.54 | 0.54 | 0.23 |
| GSG | -53.18% | 25.44% | 0.5 | 0.66 | 0.18 |
Source: portfoliovisualizer.com (5/2/2018 – 5/2/2023)
BCI’s standard deviation was relatively low in the last 5 years, but its risk-adjusted returns don’t look very attractive. COM is clearly the superior choice here as well.
We know there are options when it comes to passive ETFs offering exposure to commodities now. What about actively managed ones though? If you’re like me who doesn’t care about this difference, you’d like to see how BCI fared against such funds too.

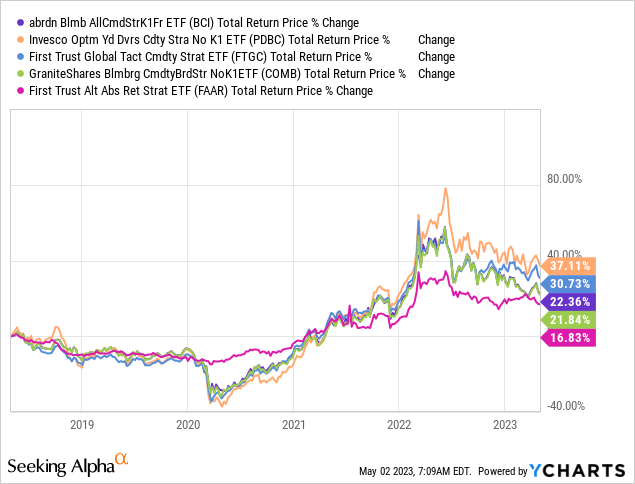
Evidently, there are two more funds here as well that have done better by a wide margin; the Invesco DB Optimum Yield Diversified Commodity Strategy No K-1 ETF (PDBC) and First Trust Global Tactical Commodity Strategy Fund ETF (FTGC). What really stands out is the more stable performance of the First Trust Alternative Absolute Return Strategy ETF (FAAR). Let’s also take a look at some risk statistics for these ones too:
| Ticker | Maximum Drawdown | Standard Deviation Annualized | Correlation (SPY) | Beta (SPY) | Sharpe |
| BCI | -30.49% | 15.72% | 0.52 | 0.43 | 0.25 |
| PDBC | -37.58% | 19.13% | 0.52 | 0.52 | 0.35 |
| FTGC | -33.07% | 15.23% | 0.56 | 0.45 | 0.34 |
| COMB | -30.79% | 15.97% | 0.52 | 0.44 | 0.24 |
| FAAR | -13.83% | 8.83% | 0.22 | 0.1 | 0.2 |
Source: portfoliovisualizer.com (5/2/2018 – 5/2/2023)
It seems that the two funds that outperformed BCI are also attractive on a risk-adjusted basis. FAAR has the lowest Sharpe but its volatility and correlation were exceptionally low, making it a very good diversifier. In any case, investors have enough alternatives to BCI when it comes to active management too.
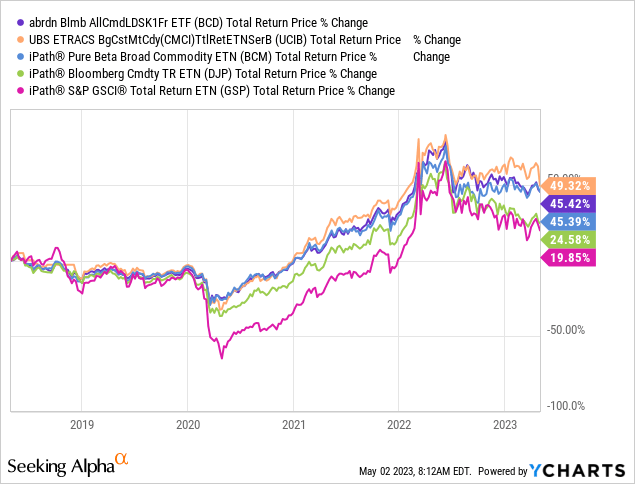
Now, I took a look at some commodity ETNs to see if there are more alternatives:

If you are looking to invest in commodities for the long term, ETNs can be a good choice because of their elimination of tracking error at maturity. However, it seems that there are no ETNs that outperformed BCI to a significant degree for them to deserve further analysis, in my opinion.
Fees
| Ticker | Expense Ratio | AUM | Inception Date |
| BCI | 0.25% | $910.13M | 03/30/2017 |
| COM | 0.81% | $304.66M | 03/30/2017 |
| BCD | 0.29% | $272.41M | 03/30/2017 |
| DBC | 0.85% | $2.13B | 02/03/2006 |
| CMDY | 0.28% | $339.59M | 04/03/2018 |
| USCI | 1.01% | $196.40M | 08/10/2010 |
| COMT | 0.48% | $842.64M | 10/15/2014 |
| GSG | 0.75% | $1.05B | 07/10/2006 |
BCI charges an expense ratio of 0.25% and that makes it the most cost-effective commodity ETF among the biggest index-tracking competitors. However, I think that BCD’s 0.29% expense ratio is very competitive if you account for its outperformance, both on an absolute and risk-adjusted basis. For this reason, I don’t see why someone should consider BCI for its low fees.
Risks
- Counterparty Risk: BCI invests in futures contracts on commodities and is, therefore, exposed to the danger the other party in a futures transaction becomes unable to fulfill its obligation.
- Commodity Risk: The ETF is also subject to the risk that comes with being invested in commodities and various market events, war, and regulatory developments can have an adverse effect on the fund’s investments.
- Credit Risk: Investing in BCI also involves credit risk because of its investments in fixed-income securities.
Verdict
In conclusion, while BCI is a very popular choice for those looking for exposure to commodities, I think that there are enough better choices available for different purposes.
COM, which I recently covered, is the best bet for attractive risk-adjusted returns and FAAR looks like the most prudent choice if you prioritize diversification quality due to its exceptionally low correlation to the market.
So, what’s your intent? You may prefer some other commodity ETF for some reason, so let me know below. Also, leave a comment if this post was helpful; or not (I appreciate feedback and suggestions). Thank you for reading.
Read the full article here


