After getting stomped in 2022, tech is back in the market’s good graces – it’s leading all others so far in 2023, rising 38%. As we’ve mentioned in previous articles, that’s a mixed blessing for retail income investors due to tech’s very low dividend yield.
However, there are certain tech-based funds that offer you an attractive yield, such as BlackRock Science And Technology Trust (NYSE:BST) and/or its sister fund, BlackRock Science and Technology Trust II (BSTZ). These are both closed-end funds.
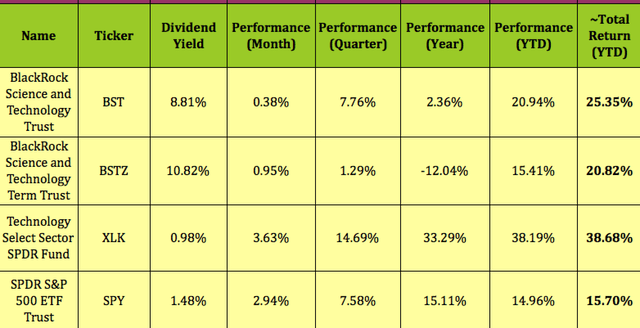
Like tech, both funds were down in 2022, but they’ve come alive in 2023, with BST up ~21% and BST up 15.4%. Add in six months of dividends and the year-to-date total returns look even better, at ~25% and ~21% respectively, vs. 15.7% for the S&P 500.
That’s not nearly as strong of a return as the broad tech sector has thus far, at 38.7%, but it does provide attractive income for passive income investors.
Hidden Dividend Stocks Plus
Fund Profiles:
BST is a perpetual CEF which began operations in October 2014 with the investment objectives of providing income and total return through a combination of current income, current gains and long-term capital appreciation.
Under normal market conditions, BST will invest at least 80% of its total assets in equity securities issued by U.S. and non-U.S. science and technology companies in any market cap range. BST’s management sells covered call options on a portion of the common stocks in its portfolio. (BST site)
BSTZ is a limited-term CEF. BSTZ began operations in June 2019 with the investment objectives of providing total return and income through a combination of current income, current gains and long-term capital appreciation.
BSTZ normally invests at least 80% of its total assets in equity securities issued by U.S. and non-U.S. science and technology companies in any market cap range, selected for their rapid and sustainable growth potential from the development, advancement and use of science and/or technology. BSTZ’s management also sells covered calls on part of its portfolio. (BSTZ site)
BSTZ is the newer of the two funds – it IPOd in 2019. It has a larger asset base, of $1.65B, with ~2X the average volume for BST.
BST has 32.4% of its assets exposed to covered calls, vs. 25.42% for BSTZ. BST has 307 holdings, vs. 106 for BSTZ. At 1.33%, BSTZ’s expense ratio is a bit higher than BST’s 1.11% figure. Neither fund uses leverage.

Hidden Dividend Stocks Plus
Dividends:
At its 7/6/23 closing price of $32.04, BST yielded 9.36%, vs. 11.09% for BSTZ. Both funds go ex-dividend on 7/13/23, with a 7/31/23 pay date.
BST has an impressive five-year dividend growth rate of 26.38%, mainly due to its 100%-plus growth in 2021, when it paid $4.26, vs. $2.05 in 2020. BSTZ recently cut its dividend in March ’23 from $.1920 to $.1613.

Hidden Dividend Stocks Plus
Taxes:
BST – 28% of 2022 distributions came from return on Capital, with the balance coming from prior net realized gains. BST had -$20.29/share in investment operations in 2022. Coupled with its $3.00 in distributions, NAV declined from $52.40 to $29.11 in 2022, a stark contrast vs. 2021, when its NAV increased from $51.94 to $52.40/share, even after paying $4.27 in distributions.
So far in January -June 2023, BST’s distributions are estimated to be 100% return of capital:

BST site
It’s a slightly different story for BSTZ, with 87% of its 2023 distributions estimated to be return on capital, and 13% coming from long-term capital gains:

BSTZ site
Holdings:
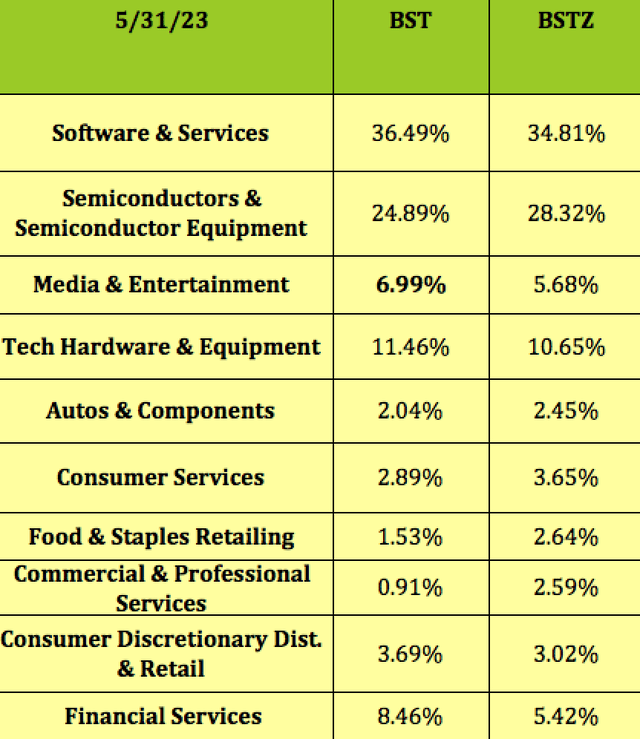
The largest differences in the two funds’ sector exposures are in semis and financial services, with BSTZ holding a larger position in semis, and a smaller position in financial services:
Hidden Dividend Stocks Plus
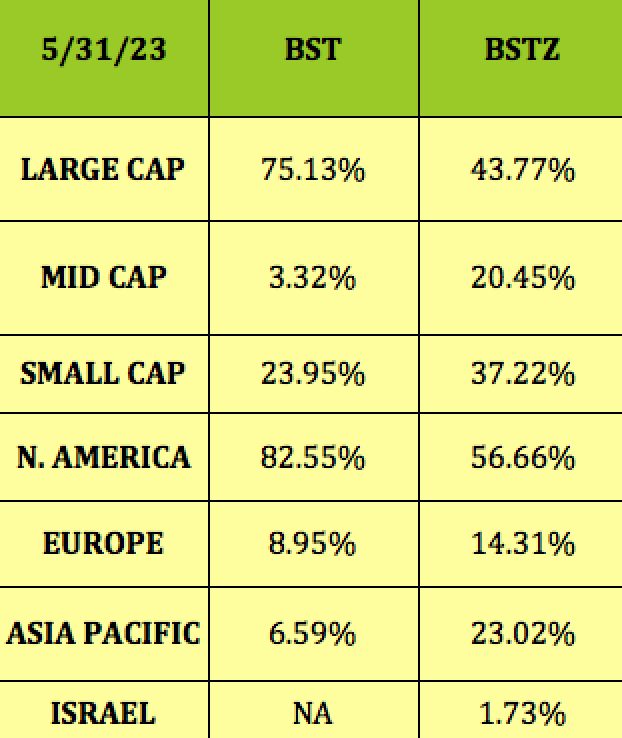
The major difference between these two funds lies in their market cap and regional exposures. BSTZ’s bias toward rapid and sustainable growth potential gives it a much lower large cap exposure than BST, with much higher exposure to mid-caps and small caps.
BST has 82.5% exposure to US companies, vs. 56.7% for BSTX, which has much higher exposures in Europe and Asia:
Hidden Dividend Stocks Plus
BST‘s top 10 holdings include many big cap familiar tech names, including Apple (AAPL) and Microsoft (MSFT), which form 16.8% of its portfolio. The top 10 holdings comprise 38.42% of the portfolio:

BST site
BSTZ‘s top 10 includes Nvidia (NVDA), at 3.89%, and Tesla (TSLA), 2.45%, but heavily favors lesser-known tech names, forming ~33% of its portfolio.

BSTZ site
Long-Term Performance:
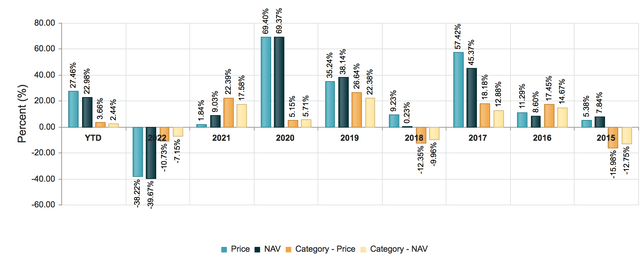
BST lagged the Morningstar Equity CEF sector in 2021 and 2022, but outperformed it on a price and NAV basis in 2017 – 2020, and in 2015, and has outperformed it so far in 2023. As of 5/31/23, BST had an NAV total return of 281% since its inception.
BST site
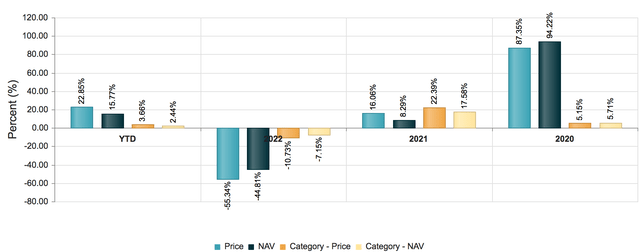
BSTZ has a much shorter history – it underperformed in 2021-2022, and outperformed in 2020. It also has outperformed so far in 2023. As of 5/31/23, BSTZ had an NAV total return of 40% since its inception.
BSTZ site
Valuations:
Buying CEFs at a deeper than historical discount can be a useful strategy due to mean reversion. At its 7/5/23 closing price of $34.45, BST was selling at a 1% premium to NAV/share, which is higher than its 1- and 3-year average prices to NAV, and slightly lower than its five-year average.
At $18.29, BSTZ was selling at a 14.73% discount to its 7/5/23 NAV/Share, which is a much deeper discount than its three-year 10.14% average discount.

Hidden Dividend Stocks Plus
Parting Thoughts:
BST has a long track record of positive returns, and an attractive yield. Try to buy it a lower premium on a market down day. BSTZ has a higher yield, and a deep discount, but is more volatile.
All tables furnished by Hidden Dividend Stocks Plus, unless otherwise noted.
Read the full article here


