The broad market enthusiasm, which has been reinvigorated by inflation seemingly fading away and the Fed finally pausing the hiking cycle in June, spurred a growth rotation this year, with a plethora of vehicles that were languishing in 2022 eventually embarking on a recovery path. A nice example here is the Davis Select U.S. Equity ETF (BATS:DUSA), an actively managed exchange-traded fund leveraging a U.S. focused high-conviction concentrated strategy. According to its website, being “benchmark-agnostic,” the fund “seeks to outperform the index, not mirror it.” It is also said that the vehicle has “a strategic, long term time horizon.” The factsheet contains the following description:
Davis Select U.S. Equity ETF is an actively- managed portfolio of large-cap businesses, selected using the time-tested Davis Investment Discipline. The Fund’s investment objective is long-term capital growth and capital preservation.
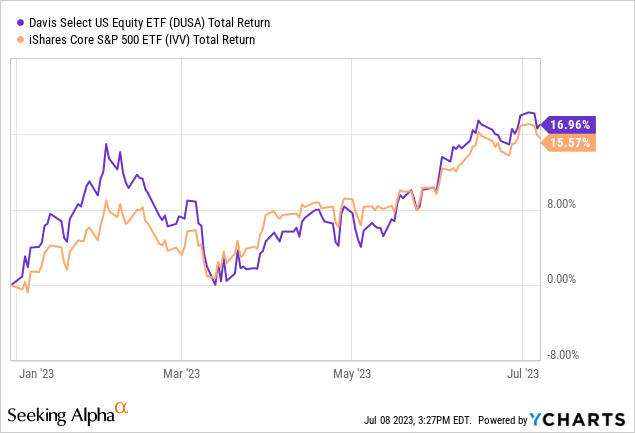
DUSA has beaten the iShares Core S&P 500 ETF (IVV) by almost 1.4% in total return, outperforming it every month except for February and March.
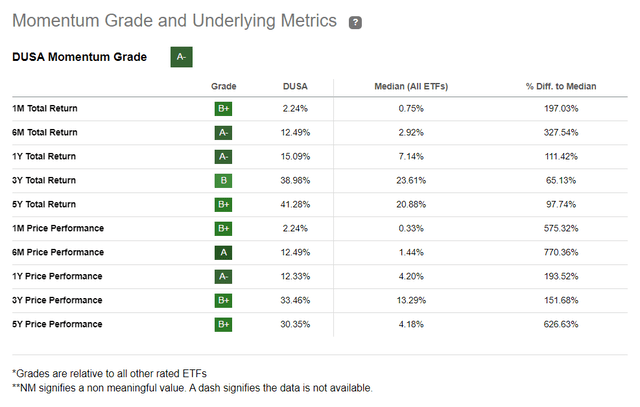
As a consequence, the fund has earned an A- ETF Momentum grade, implying that investors who are pondering an option to play the continuing market recovery should at least place this outperformer on a watch list.
Seeking Alpha
Nevertheless, despite these results being indubitably encouraging, I am tilting toward a more skeptical view. A few months of outperformance mask a more complex story beneath the surface, including its lackluster returns in the past, a disproportionate sector mix overreliant on financials (which has taken its toll on its results earlier their year), as well as a few issues on valuation and growth fronts. In this regard, I see no bullish case for this vehicle.
DUSA continuously lagged IVV in the past
Incepted in January 2017, DUSA underperformed IVV every year except for 2023 YTD. Another way of saying, despite being actively managed (hence, capable of positioning tactically to capture the prevailing market forces), it was unable of optimizing the portfolio to immunize it against the ripple effects of the trade war in 2018-2019, then did not benefit from the market euphoria post-March 2020 coronavirus sell-off, missed on the vaccine-induced capital/value rotation in 2021, and finally suffered more amid the raging bear market last year.

Created by the author using data from Portfolio Visualizer
Interestingly, DUSA’s oversized bets on financials (46.8% of the portfolio as of July 6 as per my calculations), principally on U.S. heavyweight banks like JPMorgan Chase & Co. (JPM), was most likely behind its 2.5% negative total return in March 2023 when it underperformed IVV by 6.2%.
Another table adds a bit more context (based on the February 2017 – June 2023 period), summarizing the annualized performance, standard deviation, correlation, and other relevant data.
| Portfolio | DUSA | IVV |
| Initial Balance | $10,000 | $10,000 |
| Final Balance | $17,195 | $21,876 |
| CAGR | 8.81% | 12.98% |
| Stdev | 19.47% | 16.90% |
| Best Year | 30.54% | 31.25% |
| Worst Year | -19.55% | -18.16% |
| Max. Drawdown | -28.72% | -23.93% |
| Sharpe Ratio | 0.46 | 0.72 |
| Sortino Ratio | 0.66 | 1.09 |
| Market Correlation | 0.93 | 1 |
Created by the author using data from Portfolio Visualizer
Unfortunately, these metrics offer little solace as DUSA underperformed the S&P 500 ETF by more than 4%, with its 61 expense ratio clearly being among the detractors. Also, the fund suffered from a much steeper drawdown, the standard deviation was higher, while risk-adjusted returns measured using the Sharpe and Sortino ratios were lower.
Concerns on valuation, quality, and growth fronts
As of July 6, DUSA had a portfolio that I would call an ultra-minimalist one, as there were just 27 equity holdings inside, in line with the managers’ high-conviction concentrated approach. U.S. companies dominate this mix, accounting for 83.7% as per my analysis. The rest is allocated mostly to developed world names like DBS Group Holdings (OTCPK:DBSDY), a Singapore-based diversified banking heavyweight. Please take notice that the ETF has some emerging market exposure as well via its investment in Hong Kong-listed, Shenzhen-based Ping An Insurance (Group) (OTCPK:PNGAY). DBS adds some hidden EM exposure as well; for instance, the group is rapidly expanding in India, with an ambition to “sustain a 25-30% income growth for improved cost-income ratio and ROE” by 2026.
As I said above, DUSA is enamored of financials. Interestingly, looking a few years back, the fund was still grossly overweight in the sector as the data from August 2020, which I downloaded using the webpage saved by the Wayback Machine, illustrate. As of 3 August 2020, DUSA had about 42.7% of the net assets deployed to financials including bellwether U.S. banks like JPM, Bank of America (BAC), U.S. Bancorp (USB), etc., also having a sizable position in Berkshire Hathaway (BRK.B). DBS Group was also in the portfolio.
Next, it is of note that the fund has no intention of capturing all the sector spectrum as energy, consumer staples, utilities, and real estate names are simply absent in the current version.
| Sector | Weight |
| Communication | 16.11% |
| Consumer Discretionary | 10.03% |
| Financials | 46.75% |
| Health Care | 9.86% |
| Industrials | 3.66% |
| Information Technology | 8.02% |
| Materials | 1.97% |
Created by the author using data from the fund, iShares Russell 3000 ETF (IWV), and Seeking Alpha
So, since banks, insurance companies, and the like tend to occupy leading positions in this portfolio and exposure to permanently expensive sectors like IT is kept at a minimum, attractive portfolio-wise valuation should be expected. My calculations show DUSA’s weighted-average earnings yield of 6.5%, which is not surprising. The key contributors are Capital One Financial Corporation (COF) and Viatris (VTRS). And this is despite the ETF having two $1 trillion league members in the portfolio, Alphabet (GOOG) and Amazon (AMZN), with the WA market cap standing at $408 billion.
However, the situation is much more nuanced. First, the P/B ratio (which I personally dislike, but since the basket is financials-heavy, EV/EBITDA is inapplicable, so compromises should be made) is at 3x, which does not look completely comfortable as AMZN and Applied Materials (AMAT) with their ratios in the high-single-digits push the metric higher. Next, though Price/Sales looks adequate at 2.9x, it should not be overlooked that the ratio is most likely influenced by the lukewarm growth profile as the WA forward revenue growth rate is at 5.5% only, with the main detractors being 5 companies which are forecast to deliver revenue contraction, including Intel (INTC) and VTRS. Another problem, and a much more worrisome one, is that about 14% of the holdings are expected to deliver declining EBITDA going forward. And ultimately, almost 49% of the companies score poorly against Quant Valuation grades, with D+ rating or worse.
Regarding quality, the mix is overall strong as close to 89% of the holdings have a Quant Profitability grade of at least B-. Still, I am not impressed with its 4.9% WA Return on Assets and 12.3% Return on Equity, even though a WA net margin of 15.3% appeal to me.
Final thoughts
DUSA is an actively managed investment vehicle with a concentrated portfolio of mostly U.S. mega and large caps, also with a footprint in developed markets like Canada and Singapore, and with minor exposure to EMs as well. Almost 44% of its net assets are allocated to the 5 main holdings. The 5 smallest equity positions account for just 4.4%.
DUSA has beaten the S&P 500 ETF this year amid the growth rotation. But it would be myopic to focus only on recent performance. The longer-term returns reveal the strategy’s weaknesses as the ETF underperformed IVV every single year since its inception except for 2023, also delivering higher volatility and suffering from deeper drawdowns. From a factor perspective, DUSA has an attractive earnings yield and adequate quality, but revenue growth is lukewarm.
I appreciate the fund’s high-conviction, low-turnover approach with emphasis put on U.S. financials, but owing to the weaknesses discussed, I would opt for a Hold rating only.
Read the full article here


