Introduction: The Power of 10x Returns
The thought of owning a 10-bagger has probably enchanted public market investors for centuries. I became familiarized with the term ‘bagger’ first when I read Peter Lynch’s “One Up On Wallstreet”. Peter points out that an investor doesn’t need to get everything right, given that the investor gets one investment very right. This can be exemplified with a simple thought experiment: you invest $10,000 equally into ten positions, nine positions lose an average 50% value, and one position appreciates 10x. During your holding period, you will have a portfolio worth 9($500) + $10,000 = $14,500. So, even with the pessimistic assumption that you lose half of your money on nine positions, the picking of a 10-bagger will lend you a 45% return.
10-baggers are astonishingly powerful but very difficult to achieve. As seen below, time is your friend when trying to achieve a 10x return. When comparing the prospect of achieving the return in between 2-20 years, the required annual compounded return will range between 216.2-12.2%.
| Years Until 10-Bagger | Required Annualized Return |
| 2 | 216.2% |
| 5 | 58.4% |
| 7 | 38.9% |
| 10 | 25.9% |
| 15 | 16.6% |
| 20 | 12.2% |
Christopher Mayer expands Peter Lynch’s bagger framework from 10-bagger to whopping 100-baggers. In his book, “100 Baggers: Stocks That Return 100-to-1 And How To Find Them” Mayer studies a population of 365 100-baggers between 1962 and 2014. Even more important for 100-baggers is time, as seen below.
| Years Until 100-Bagger | Required Annualized Return |
| 15 | 36% |
| 20 | 25.9% |
| 25 | 20% |
| 30 | 16.6% |
| 35 | 14% |
Moreover, both Lynch & Mayer have noticed other characteristics that are shared by 10- to 100-baggers. Since there are certain characteristics that correlate with outsized returns, I believe that investors can systematically choose stocks that have a higher likelihood of becoming 10-baggers compared to others.
In this series, I will be rating two companies based on pre-determined criteria which have been found to increase the chance of a stock becoming a 10-bagger. My goal in this series is hence to give investors a quick checklist of 10-bagger factors for a couple of companies while comparing the time perspective with which they may achieve the 10-bagger status or why they may fail to.
This article is dedicated to two up-and-coming software giants: Palantir (PLTR) and Snowflake (SNOW).
The 10-Bagger Rating List
With inspiration from Christopher Mayer and Peter Lynch, as well as my own experience with investing I have created the following rating list, which ranges from 1-10, with what I believe are the most important factors that contribute to a potential 10-bagger status. (if you have any recommendations for new factors, please let me know in the comments!)
Rating List
- Profitability (“ROIC”), (“ROE”), (“ROCE”)
- Insider Ownership
- Share Repurchases
- Gross Profit Margin
- Intangibles
Profitability: Ex. Returns on Invested Capital (“ROIC”), Return on Equity (“ROE”), Return on Capital Employed (“ROCE”)
| Rating | Level |
| 1-2 | <(0)-2% |
| 3-4 | 3-6% |
| 5-6 | 7-9% |
| 7-8 | 10-15% |
| 9-10 | 15%+ |
Insider Ownership
| Rating | Level |
| 1-2 | 0-5% |
| 3-4 | 5-10% |
| 5-6 | 10-25% |
| 7-8 |
25-50% |
| 9-10 |
50%+ |
Share Repurchase (yearly % purchase of outstanding shares)
| Rating | Level |
| 1-2 | <(-5%) |
| 3-4 | (-5)-(0%) |
| 5-6 | ±0% |
| 7-8 | 1-5% |
| 9-10 | 5%+ |
Gross Profit Margin
| Rating | Level |
| 1-2 | Compressing |
| 3-6 | Steady |
| 7-10 | Expanding |
Intangibles
| Rating | Intangible Asset |
| 1-10 | Company Culture |
| 1-10 | Industry Potential |
| 1-10 | Operating Leverage |
1. Palantir: $32 Billion Market Cap
($320 Billion for 10-Bagger status)
| Characteristic | Level | Rating |
| Returns on Capital Employed (“ROCE”) | 5,89% | 4 |
| Insider Ownership | 10,44% | 8 |
| Share Repurchases | -5.5%/year | 1 |
| Gross Profit Margin | Expanding | 8 |
| Intangibles | Strong | 7,7 |
Total Points: 28,7/50
Returns on Capital Employed (“ROCE”)
I will use the most recent quarter (Q1 2023) for this calculation, as well as the previous three quarters in order to retrieve the most updated (Twelve trailing months) reflection of company performance. When going through Palantir’s balance sheet, I found that the company has negative invested capital which makes “ROIC” a difficult measure to use to gauge company performance. Therefore, I will use Returns on Capital Employed (EBIT/Long-term debt + Equity) in order to get a better understanding of the company.
The Author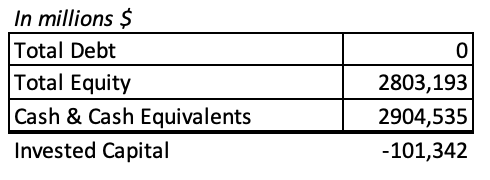
To begin with, let’s look at the trailing twelve months’ EBIT for Palantir. In order to obtain more accurate ratios, I have decided to capitalize R&D for three years. This is amortized quarterly in my table below. When adding back expensed R&D, we find that Palantir is profitable on an operating level.
The Author
For the full year, Palantir earned an EBIT of (166,84 + 0,86) = $167,7 million, which in turn equates to a 5,89% “ROCE” on a twelve trailing months basis. The profitability of Palantir is still quite low, which is why I rate it a 4/10 with regards to “ROCE”. In Q1 of 2023, the company turned profitable on a GAAP basis, which also substantially increased its adjusted net operating profit after tax. I expect “NOPAT” to continue growing and it could expand quite dramatically again in the coming quarters. This in turn will lead to higher profitability.
The Author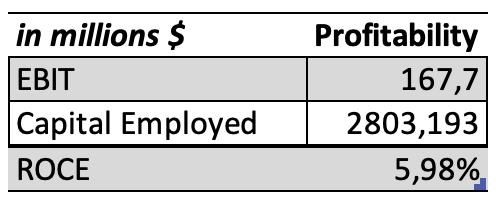
Insider Ownership
Palantir is led by its insiders/founders since it was founded in 2003. Alex Karp, the current CEO has held the position since the company was founded and personally holds ~84 million shares in the company which equates to a market value of roughly $1.3 billion. Other founders include Peter Theil and Stephen Cohen, and only the latter is still an active part of the company’s management (Palantir Management Team). In total, Seeking Alpha estimates that individuals/insiders own 10.44% of the outstanding shares in the company. This would give Palantir a rating of 5-6 on the 10-bagger scale, but there is more to be said about the insider ownership structure within the company.
Seeking Alpha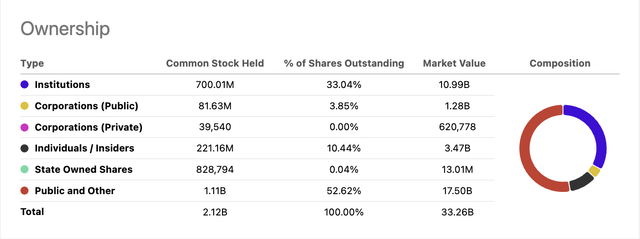
Although insiders own a total of 10.44% of the outstanding shares, they control 50.4% of the voting rights within the company. The dual class structure of the executive’s shares allows management to wield even more power over the strategic priorities within the company.
Palantir Proxy Filings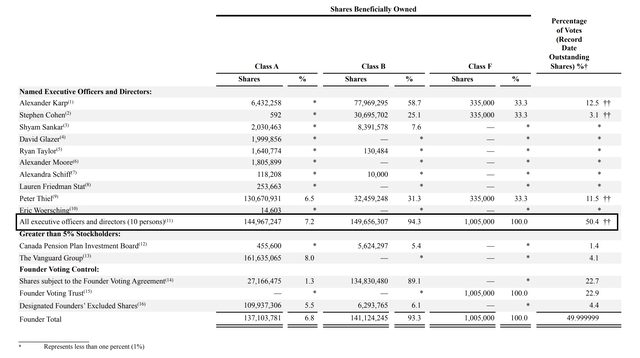
Furthermore, management earns a salary of about $500,000 to $1,000,000 while having significant amounts of compensation based on stock performance. We can see from the proxy filing that Alex Karp has about 119 million option awards at a strike price of $11.38, with an expiration in 2032. The other executives have a similar package, but it is scaled down with regard to the number of underlying units held. This type of compensation package creates extreme incentives for management to continue performing at high levels. Although the option programs are currently ‘in the money’, slight increases in Palantir stock create outsized returns for these executives.
Palantir Proxy Filings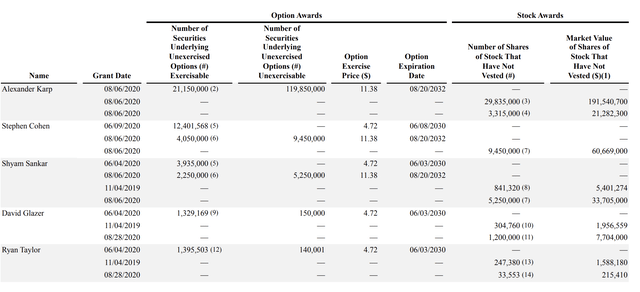
In sum, I give Palantir a stock ownership rating of 8/10 because although it does not fulfill the 25-50% ownership level, the executives of the company have complete voting control at 50.4% and they are heavily incentivized to perform well with stock compensation programs. One risk with only marginal voting control is that internal struggles may lead to a lack of consensus. This in turn could move the needle on decisions made by the board. Furthermore, if an executive decides to depart from the company and sell his shares then the executives no longer have the majority of voting power.
Share Repurchases
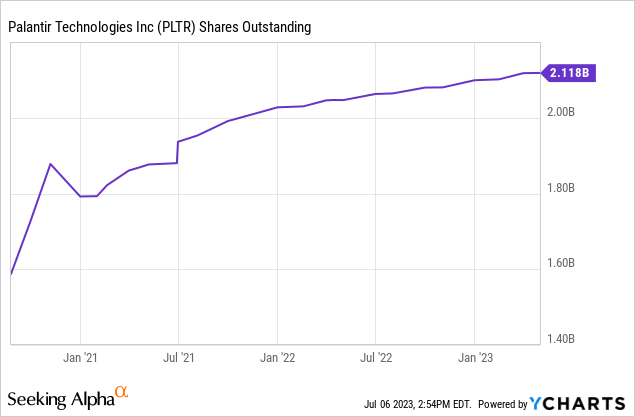
One big critique that Palantir has gotten is that it dilutes its shareholders heavily through stock-based compensation. Since going public, the company has increased its share count from 1.6 billion to 2.11 billion. However, the amount of dilution is markedly slowing down and management has signaled that they are aware of the costs associated with diluting shareholders. For the past two years, Palantir has diluted shareholders by roughly 11% which lends the company a rating of 1/10 on the 10-bagger scale for share repurchases.
Gross Profit Margins
Since 2018, Palantir has significantly expanded its gross profit margin while also growing revenue rapidly. After a large dip in gross margin from 72% in 2018 to about 68% in 2019 and 2020, the company has significantly increased its margin to 78.5% in 2022. The 10% margin increase over the past two years motivates me to give Palantir a rating of 8/10 with regard to gross profit margin. Can the company continue raising its margins going forward? For SaaS companies, gross margins usually lie around 80% which gives Palantir marginal room for improvement. So although the increase in margins has been historically very high – which could warrant a 10/10 rating – the company may not have much more room for expansion. Despite this, Palantir delivered a 79.4% gross margin in Q1 of 2023 which bodes very well for the prospects of continued price increases.
The Author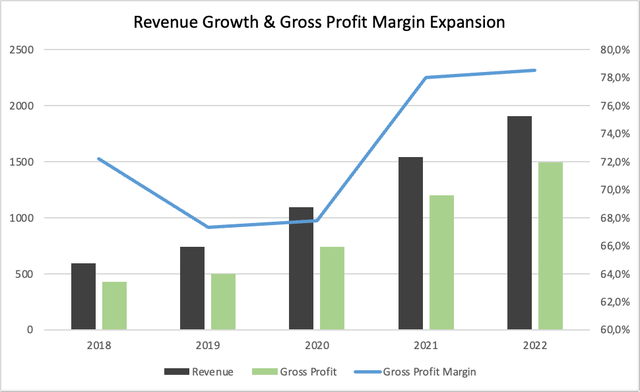
Intangibles
| Rating | Intangible Asset |
| 9 | Company Culture |
| 8 | Industry Potential |
| 6 | Operating Leverage |
Average Points: 7,7
1. Company Culture
Alex Karp usually describes his job as managing stubborn, yet very talented ‘Palantirians’. Based on what I have heard from interviews, Palantirians seem to be very engineering-oriented and intrinsically motivated. Palantir has historically focused all of its resources on products and has operated without a sales team. This is slowly changing, but the company’s principles of focusing on creating great products will hold.
Furthermore, Palantir being owner-led is strongly focused on the long-term success of the company. As I wrote earlier, the executives have been leading Palantir since it was founded and they have long-term options that incentivize them to continue performing for the company. This type of dynamic is especially beneficial for shareholders because there is a reduced owner-agent problem. Personally, I feel safer owning companies with this dynamic, and Palantir’s new focus on sales could drive the company forward significantly with regard to sales. For these reasons, I rate the company culture of Palantir a 9/10.
2. Industry Potential
In the seeking alpha article “Palantir: Why I’m Still In”, Yiannis writes in February of 2023 that Palantir has a total addressable market “TAM” of $119 billion and that Slintel estimates that the company has penetrated around 1,78% of its market. Furthermore, the author expects that the “TAM” can reach $346 billion based on a market report about the data analytics industry (Precedence Research). Although Palantir doesn’t have a large market share in the commercial sector overall, it has two keen strengths. The first strength is that the company is one of the largest software providers for governments in the West. Palantir’s CTO, Shyam Sankar, can be seen testifying in Congress about the need for battle-tested software that actually works as well as calling to action increased government spending on these types of products. Since the company specialized in military software since its founding, it has a keen competitive advantage that can be difficult to budge. The second strength is the company’s position as an AI provider. In a study by IDC Palantir was ranked the largest AI software company based on sales in 2021. Palantir Foundry provides users with a unique platform to integrate AI/ML models to make real-time business decisions and it is quite astonishing that Palantir has surpassed four of the largest companies in the world in this area (Alex Karp Shareholder Letter, September 2022). Since Palantir is so uniquely positioned within AI/ML & government software, I believe that the company’s core business is quite durable. Furthermore, the company’s exploration into a wider market will only serve to benefit them further in regard to sales growth and incremental operating leverage. For these reasons, I rate Palantir an 8/10 with regard to industry potential.
Palantir CEO Letter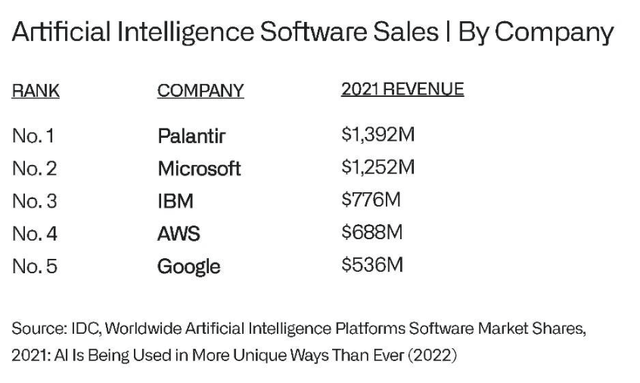
3. Operating Leverage
There is a significant, yet relatively unexplored, business model within Palantir that could drive high operating leverage. This business model involves using Palantir’s ontology platform in Foundry in order to build products and re-sell them. Essentially, Palantir could take a cut for products that are purpose-built and resold. This business model has minimal operating costs (server costs) and very little overhead costs once the business has taken off. One promising business model such as this one is Palantir FedStart, which allows defense companies/startups to get on a fast track to receiving IL5 or IL6 accreditation which is required to compete for certain military contracts. What could traditionally cost over $1 million, require dedicated compliance & engineering teams, and take over 18 months can be managed completely by Palantir, require 1 or 2 engineers, and take on average 3 months, all while costing significantly less than when using traditional methods. This is a SaaS offering that has operating leverage since Palantir does not need to establish a team to help a company with its accreditation since the software is designed to do so. Shyam noted on Twitter that VCs invested $17 billion in 200 defense tech companies in 2023 so far, all of which could use Fedstart to get accredited quickly. Since these initiatives are still relatively nascent and this type of ‘operating leverage product’ is not wide-scale yet, I will rate Palantir a 6/10 on this scale. As the company grows I expect these types of products to grow as well.
2. Snowflake: $56 Billion Market Cap
($560 Billion for 10-Bagger Status)
| Characteristic | Level | Rating |
| Returns on Capital Employed (“ROCE”) | -3,59% | 1 |
| Insider Ownership | 10,11% | 6 |
| Share Repurchases | -4.15%/yearly | 3 |
| Gross Profit Margin | Expanding | 10 |
| Intangibles | Moderate | 6,7 |
Total Points: 26,7/50
Returns on Capital Employed (“ROCE”)
Snowflake has zero debt (like Palantir), $5,3 billion of equity and $3,9 billion in cash and cash equivalents. Therefore, we could calculate a return on invested capital for the company. But, for the sake of consistency let’s look at “ROCE”.
The Author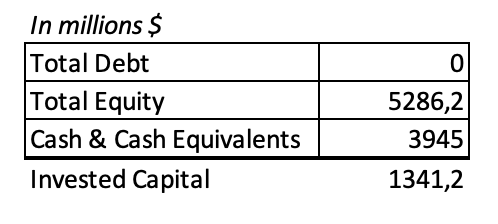
Whether we use “ROIC” or “ROCE” for Snowflake, we will run into trouble. Using the same method as with Palantir (amortizing R&D assuming a three-year life), I find that the company has a negative EBIT for the twelve trailing months. Snowflake posted an adjusted “NOPAT” of -$189,65 million (“TTM”) primarily due to high sales and marketing expenditures, but also due to very high R&D costs. Nevertheless, the company’s fast growth rate makes up for its operating losses.
The Author
Since the company has no debt, the capital employed is equal to the equity in the company. With an EBIT of -$189,7 (assuming no tax) and capital employed of $5,3 billion, the company has a “ROCE” of -3,59%. This performance falls on the very low end of the profitability scale for 10-baggers, which is why I rate Snowflake a 1/10 for this metric. I want to emphasize that I do not believe this will continue indefinitely. At a certain point, Snowflake may want to draw back on marketing expenditures and hence sales growth in return for higher profitability. But, for the time being, the company is trying to capture as much of the market as it possibly can.
The Author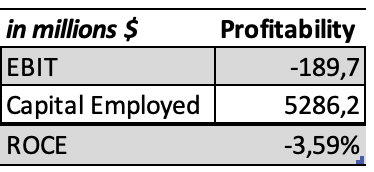
Insider Ownership
According to Seeking Alpha’s estimates, Snowflake has an impressive 10,11% insider ownership. According to the 2023 Proxy Filings, CEO Frank Slootman owns 3.8% of shares outstanding through various trusts: for ex. “Slootman Living Trust”, “Slootman Family Foundation”, “Slootman’s Grandchildren’s Trust”. From this, we can see that the CEO has a strong interest to run Snowflake well for himself, and his family. The remaining 12 members of the management team own 4,5% of the shares outstanding together of which co-founder Benoit Dageville owns 2,0%. Unlike Palantir, Snowflake is not founder-led (save Benoit Dageville) and hence the company does not have a dual-class structure that allows executives more voting rights. This means that the board of directors has more control over the company in regard to the appointment of executives in comparison to the owner-led Palantir. I do not consider this a problem, however. The CEO is himself the chairman of the board, the co-founder is also on the board, and the rest of the directors are very experienced in leading companies from ServiceNow (NOW), Dell Technologies (DELL), Adobe (ADBE), Palo Alto Networks (PANW), to consultancies such as McKinsey and Deloitte. For these reasons, I rate Snowflake a 6/10 on insider ownership.
Seeking Alpha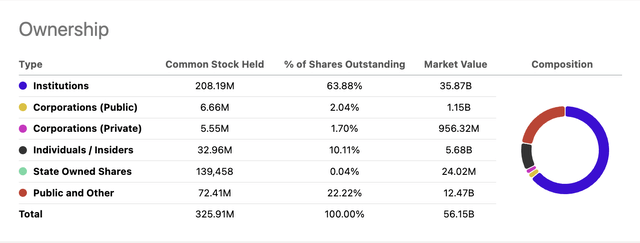
Share Repurchases
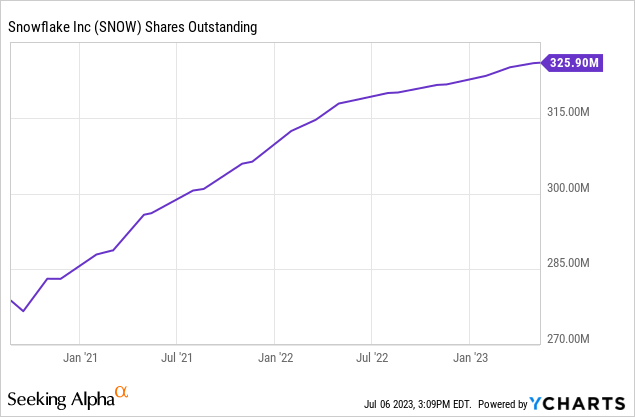
From July ’21 to July ’23, Snowflake increased its shares outstanding by 8.3% or 4.15% per year. Similar to Palantir, Snowflake has been diluting shareholders due to high stock-based compensation. In 2023 stock-based compensation amounted to $861 million which was 41.7% of that year’s revenue (Snowflake 2023 Annual Report). These are exceptionally high expenses that motivate my 3/10 rating on the 10-bagger scale.
Gross Profit Margins
Snowflake has been an impeccable sales growth story. The company reported $96 million in revenue in 2019, which four years later amounted to $2 billion (2021 Annual Report). One explanation for this growth could be pricing. In 2019 the company had a 46,5% gross profit margin. This is unusually low for a SaaS company, but perhaps it was part of their sales strategy. Since then, the company has been able to upsell and increase pricing steadily which is reflected in YoY increases in margin up until 2023. Currently, the company has gross margins of 65,3% which is almost 20% higher than it was four years prior. Unlike Palantir, Snowflake has further room for growth ahead if it is to reach 80% margins in the long term. So, due to the huge historical margin expansion and further runway for margin growth, I have rated the company a 10/10 on gross profit margins.
The Author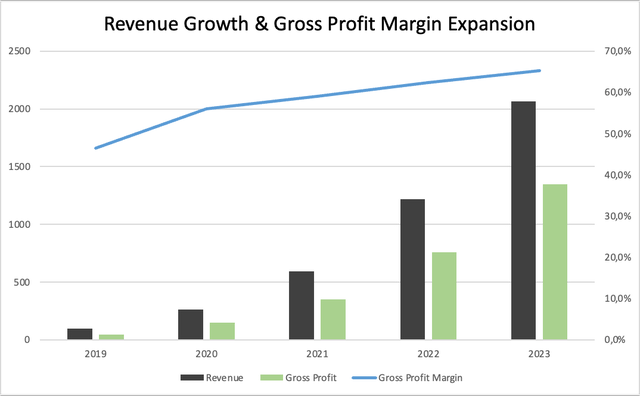
Intangibles
| Rating | Intangible Asset |
| 6 | Company Culture |
| 7 | Industry Growth Rate |
| 7 | Operating Leverage |
Average Points: 6,7
1. Company Culture
As opposed to Palantir’s more startup-oriented culture, Snowflake seems to be more ‘corporate’. The CEO Frank Slootman has worked as CEO at several software companies in the past and the board of directors is filled with individuals who have a similar experience. Furthermore, the company is very focused on sales and marketing, which in Q1 2024 made up more than 50% of revenue while R&D expenses made up around 44% of revenue. Given the fast growth of the company, its seemingly structured sales processes (which reminds me of Salesforce (CRM), a company notorious for its rigorous sales processes) set the company up for success. Snowflake currently employs 6,310 employees which represents a 7% QoQ growth (Q1 2024 Presentation).
Although the company seems to be structured, it seems too ‘corporate’ to me in comparison to Palantir. Personally, I prefer owning a very heavily founder-owned and operated company in comparison to how Snowflake is run. For these reasons, I rate the company culture a 6/10.
2. Industry Potential
Snowflake sells many SaaS products under its hood. Below is a great visual from the company’s website (Snowflake). It is involved in data storage & compute, data engineering, cybersecurity & AI modeling, all bundled in a platform for companies to share/sell applications and data.
Snowflake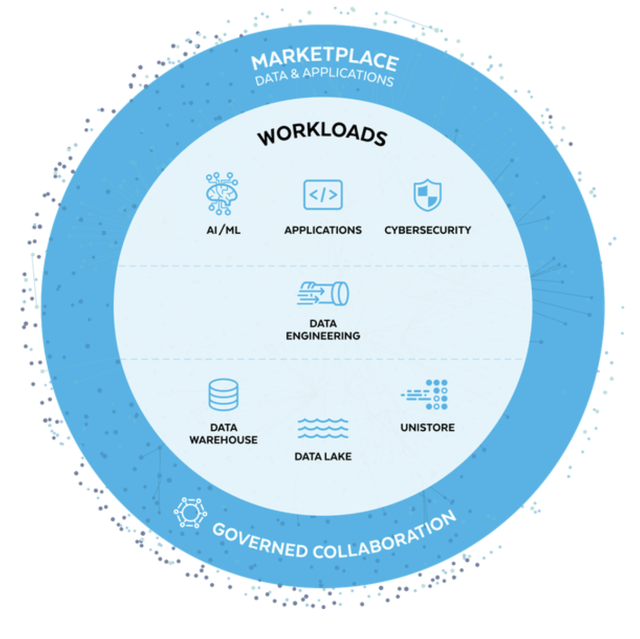
Fortune Business Insights forecasts cloud computing to grow with a 20% “CAGR” until 2030, from a market value of $569,31 million in 2022 to $2,43 billion in 2030. Furthermore, the company’s marketplace for data and applications, which Grand View Research expects to grow to a market value of $5,73 billion in 2030 will likely become one of the most valuable components of the business. These are two scopes of Snowflake’s business, but its breadth is too large to underestimate – especially given that the company already has $2 billion in revenue. Based on Gartner’s research, Snowflake had a TAM of $140 billion in 2022 which is set to grow to $290 billion by 2027 (2023 Investor Day). This implies that Snowflake has captured between 1-2% of its total market, leaving plenty of room to grow.
Having a large addressable and quickly growing market can surely be a tailwind, but it also brings a plethora of competition. The data computing industry is splattered with companies such as Informatica (INFA), Datadog (DDOG), Microsoft (MSFT), Oracle (ORCL), Amazon’s “AWS” (AMZN), and much more. Despite the heavy competition, Snowflake is leveraging a bunch of partnerships in order to create synergies and incentives for customers to join its platform. This means that Snowflake is aiming to drive customer growth while giving away some of its profits to its competition. Nevertheless, when combining a 2x “TAM” over a five-year period with increasing competition, I believe Snowflake’s industry potential is a 7/10. Snowflake will seamlessly continue growing its sales for this reason, but it will struggle with achieving profitability.
Snowflake Investor Day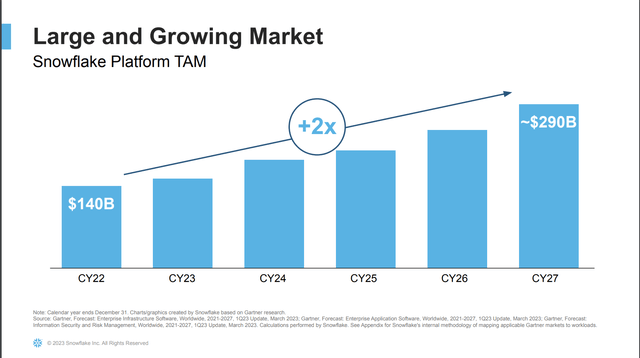
3. Operating Leverage
Snowflake has developed a product with significant operating leverage potential: a data selling/sharing platform. The company has essentially built a two-sided platform with data providers on the one hand and Snowflake customers (businesses) that want to fully leverage data on the other. In the most recent quarter, 25% of all customers have used the Stable Edge at least once, which means that they have purchased data from a data provider through the platform. Furthermore, data listing and registrants grew by 3% & 18% QoQ, respectively. The early signs of traction are promising for the prospects of this ‘operating leverage product’, but it is yet unclear how much Snowflake earns from these transactions. However, since this product has indeed gained traction and has potential for much more growth going forward I give the company a 7/10 rating with regards to operating leverage.
Snowflake Q1 Presentation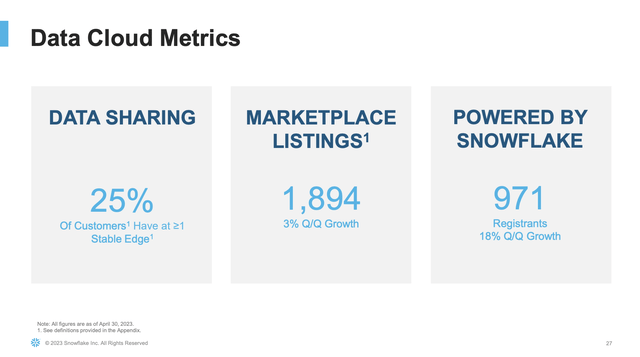
Conclusion: 10-Bagger Rating & Seeking Alpha Quant Map
I would like to conclude this article as well as future 10-bagger hunts with a map continuously plotting the companies I analyze based on my 10-bagger rating and Seeking Alpha’s quant rating. This allows us to gauge company performance with a perspective for companies that I analyze over time on a two-dimensional rating scale.
Palantir Quant Rating: 4,94/5,00
Seeking Alpha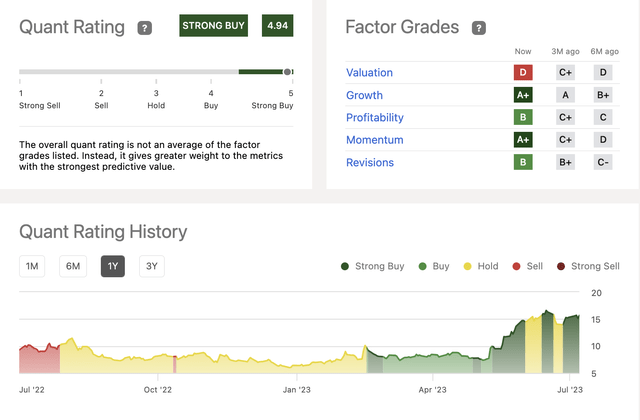
Snowflake Quant Rating: 3,21/5,00
Seeking Alpha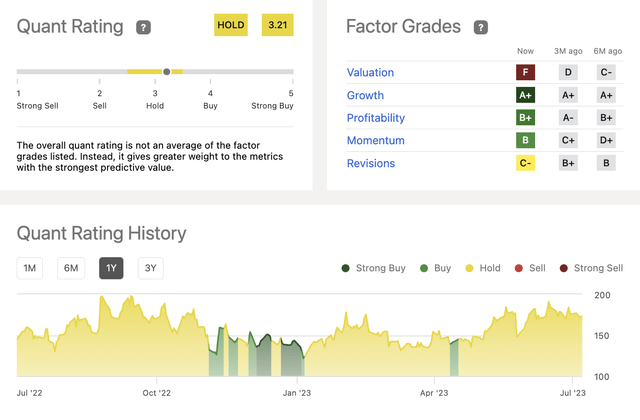
Rating Map
For this series, Palantir scored higher than Snowflake with regard to both the 10-bagger rating as well as Seeking Alpha’s quant rating. If you enjoyed this article, let me know! My plan is to search for two new potential 10-baggers per week, so if you are interested in following the series then give me a follow. All the best, thanks!
The Author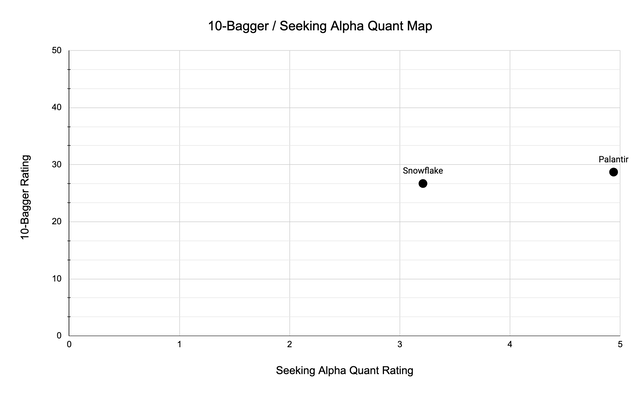
Read the full article here


