By Levi at StockWaves, produced with Avi Gilburt
Let’s briefly recap where we have been with this ride on the Energy Sector train. Remember that it was in the fall of 2020 that we turned uber-bullish nearly all names energy. The sector proceeded to be one of the best performing areas of the market for some nearly 20 months. In the early summer of 2022, we began to warn that many energy sector names were fulfilling near-term targets and that a pullback/consolidation period would ensue.
True to expectations, the sector as represented by the (XLE) pulled back sharply some -30% in just a six-week period. Since that time, we have seen further digestion of the massive run up. Across the sector as a whole we still anticipate a bit more of this type of action. However, some names will bottom out sooner rather than later. So, it’s now an auspicious moment to dive a bit deeper into some select charts and see what they are telling us.
First, let’s discuss the fundamentals of the Energy Sector with Lyn Alden.
Energy Sector Summary Via The Fundamentals With Lyn Alden
“Overall, this sector seems to remain under appreciated across the board. The prospects for energy stocks remain unclear for the next six months as the United States works through its current liquidity problem and potential 2H 2023 recession.
In the meantime, oil prices have been finding a consolidation range above $70/barrel. We could see further sharp illiquid spikes below that level like we did in March, especially during a recession, but overall, with the Strategic Petroleum Reserve already drawn down to multi-decade lows and OPEC+ willing to cut production to defend this price level, it’s a decent risk/reward to assume that prices will pop back up over $70 within a reasonable timeframe if they temporarily go under that level like they did in March.”
Oil Price Chart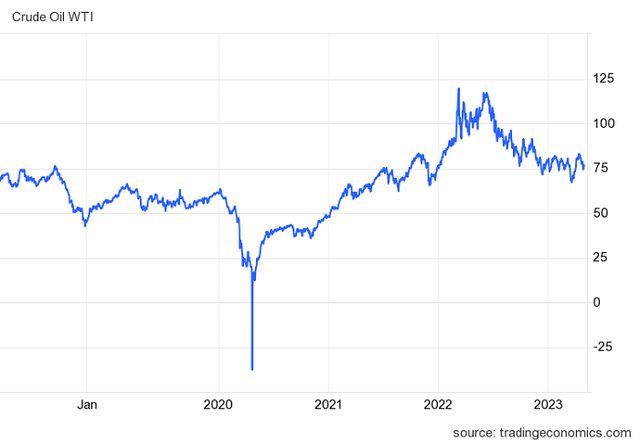
“Overall, most energy stocks never became particularly expensive even when oil was $120 in 2022, and thus have held up well even as oil has corrected back to sub $80. Even at these middling oil price levels, many large-cap oil producers make good money and trade at low valuations, which makes them able to pay high dividend yields, buy back a lot of shares, and strengthen their balance sheets.
There hasn’t been much of a capex spree or M&A spree in this oil cycle yet, which continues to suggest it’s still in its early innings. There isn’t a lot of new supply coming online on the observable capex horizon, even as the spread between supply and demand remains rather tight. Higher interest rates also increase the development cost for new production, and so while they can rein in demand to varying degrees, they also rein in new supply.”
- Large oil and gas producers with low decline rates likewise are inexpensive cash cows in this environment, even with $70 oil in many cases. Their balance sheets are generally great, and they’re roughly maintaining production levels while sending a lot of capital back to shareholders. Some have expanded production more than others, but as an industry they’ve been using a conservative strategy overall.
- Small producers are generally very cheap relative to reserves at this time and represent attractive acquisition targets, but have more volatility and insolvency risk during periods of lower oil and gas prices.
- The pipeline companies that issue K-1 forms during tax season, like Enterprise Products Partners (EPD), remain historically cheap, high-yielding, and with above-average distribution coverage ratios. Rather than constantly issuing equity like they used to, some of them are even buying back units.
“Apart from the oil price, a key risk for these companies continues to be windfall taxes and other external interventions. Oil company stocks have generally been rangebound for a decade or two, meaning they massively underperformed other stocks. Now that they’re experiencing their current windfall, many of them are under pressure by politicians. Rather than rush into acquisitions or rapid drilling like they did in the prior cycle, oil and gas producers are generally being a lot more conservative, which will likely continue to be the case until oil prices become elevated for longer periods of time.”
From a technical standpoint, we have many charts that are in alignment with Lyn’s assessment. How might one trade some of these charts on a shorter-term basis? We’re pleased to include a new feature to our articles.
The Fibonacci Princess Proclamation
Carolyn Boroden, who is renowned for her expertise in Fibonacci price and timing analysis, joined our ElliottWaveTrader analyst team in December 2019. She’s a technical analyst and author of Fibonacci Trading, published by McGraw-Hill in early 2008. Carolyn has been involved in the trading industry since 1978, starting on the floor of the Chicago Mercantile Exchange. Her work is often featured on the “Off The Charts” segment of CNBC’s Mad Money with Jim Cramer. With her wealth of trading knowledge and mastery of all things Fibonacci, it’s no wonder that she has been designated the “Fibonacci Queen.” Carolyn literally wrote the book on Time and Price analysis with Fibonacci.
Tammy Marshall co-hosts the Fibonacci Markets & Stocks service at ElliottWaveTrader.net with Carolyn Boroden. She began working with Carolyn in 2014 when Carolyn was looking for someone to mentor and train in her room, and since then has been training with Carolyn in Fibonacci analysis using the program Dynamic Trader. With a BS in Education and a Master’s of Education in Psychology, she applies her talents as a teacher and her knowledge of psychology to teach members how to trade more accurately and effectively using specific entries and exits based on Carolyn’s Fibonacci analysis method. We affectionately know Tammy as the “Fibonacci Princess.”
So, it’s time for the princess to make a proclamation. We asked Tammy to review the three picks mentioned in this article and to find key price relationships that may provide support and resistance in the near term. Swing traders will find these levels particularly helpful as they assist to determine risk and reward.
Pioneer Natural Resources (PXD): I like PXD because the 5EMA, 13EMA and 50SMA are on the side of the bulls (moving averages). However, we are below the 200SMA. I have 2 official setup zones 208.95 – 211.86 and 198.22 – 198.63. If we take out the lower setup zone (198.22 – 198.63), we will break the bullish symmetry of this upswing, and it bodes for lower lows… either retesting the low from March 16 (177.27) or even making a lower low. If we bounce from support, just be aware of resistance on the way up starting with the first zone of resistance 232.33-234.14. If and when we bounce, I will be able to calculate targets off of the low into support.
Dynamic Trader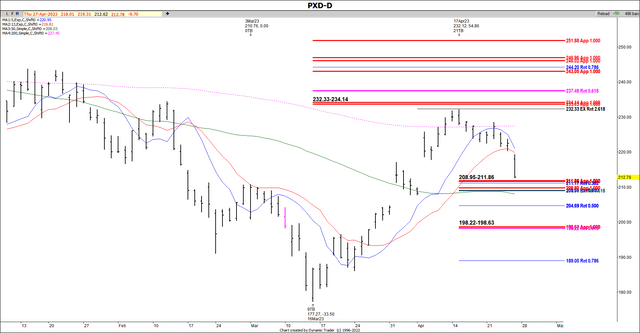
APA Corporation (APA): APA has broken the bullish symmetry of this swing up, so it may either retest the March 16 low or make a lower low. Since all of the moving averages are on the side of the bears, any buy decision will be countertrend. However, I have included some symmetrical projections that correlate with retracements if you would like some defined risk. That setup zone is 33.10 – 34.81. Please be aware of the resistance 41.56 – 43.41. If and when we bounce, I will be able to calculate targets off of the low into support.
Dynamic Trader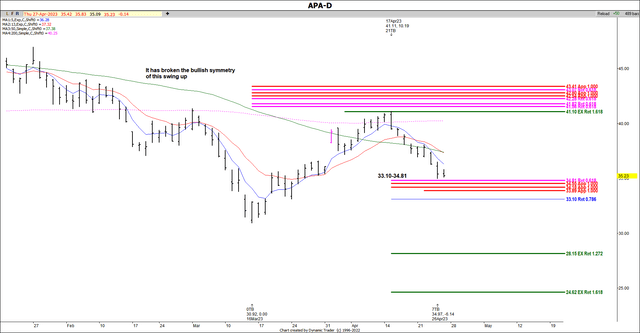
ConocoPhillips (COP): COP has all of the moving averages on the side of the bears, so any buy will be countertrend. However, it has not broken the bullish symmetry of this swing up, and I have several setup zones listed on the chart. If it breaks the symmetry at 91.95, we will retest the low from March 16, or possibly make a deeper downside correction. If and when we bounce, I will be able to calculate targets off of the low into support. Also, please be aware of overhead resistance.
Dynamic Trader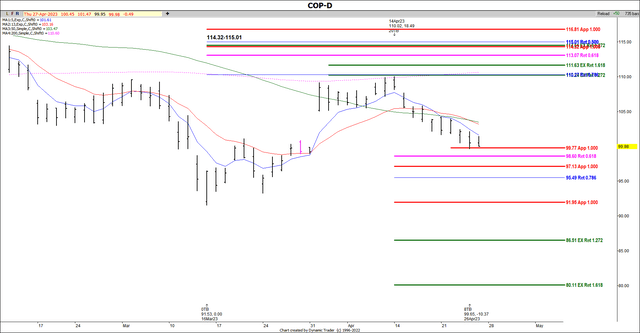
For those that are familiar with Carolyn Boroden’s work and methodology, you will know that it’s a setup plus a trigger to enter the trade and then you manage your risk thereafter. Carolyn has posted many instructive videos on YouTube that describe this in detail. I would encourage you to further familiarize yourself with this method as it is highly effective for swing traders.
Let’s Zoom Out A Bit For Some Context
A quick rewind to September 2021. We’ll use APA as our example chart and see what expectations were at that time and then how they played out.
Chart by Zac Mannes – StockWaves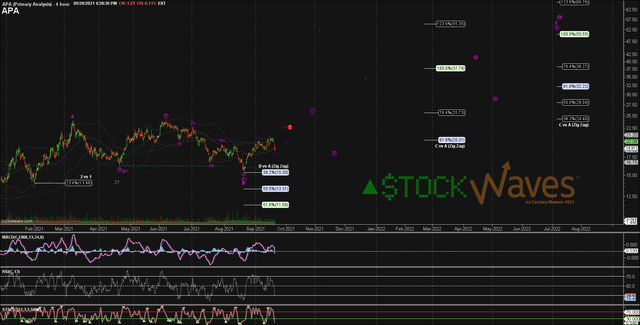
Zac has the B of wave [3] as completing and the projection is for the $50 area, perhaps by the summer of 2022. Did this play out? Indeed it did.
Chart by Zac Mannes – StockWaves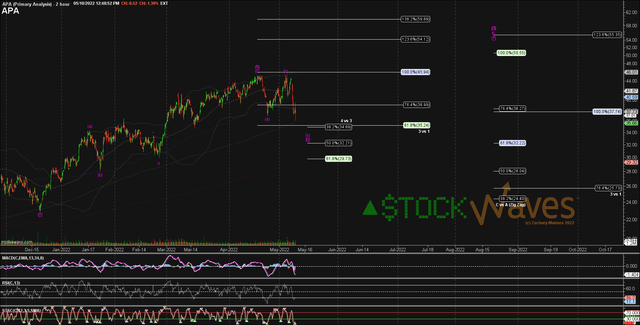
In this snapshot from May of 2022, you can see that Zac is anticipating one more high for all of wave [3]. And, again, expectations were met. It was from the top of this third wave that we anticipated a pullback/consolidation period across the energy complex. The fourth wave has taken some twists and turns, some charts pulling back more than others.
Where do we see the energy sector heading over the next six to 12 months or more? This is where the power of Elliott Wave analysis properly applied will point us in the right direction. Below, please see the three names we are discussing from a slightly zoomed out perspective.
StockWaves – MotiveWave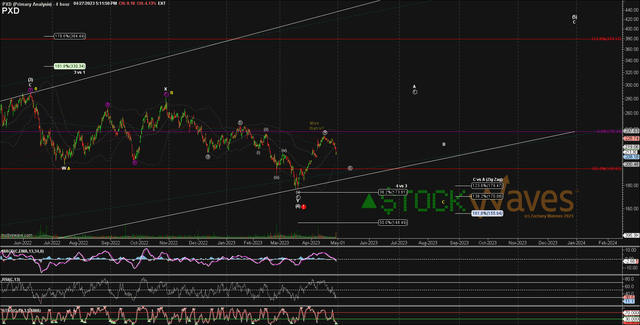
PXD: This appears to have already found an important low and is in the initial stages of a larger rally phase.
StockWaves – MotiveWave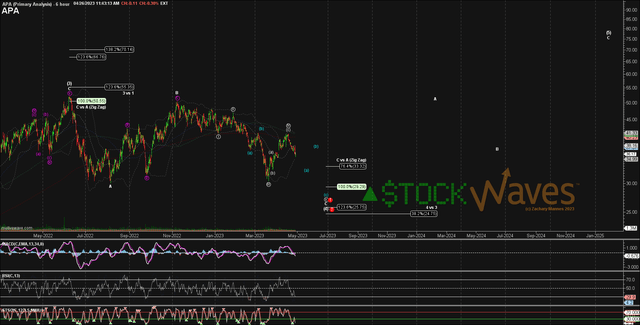
APA may need to fill in a few more squiggles lower before launching in the next rally phase as illustrated on this chart.
StockWaves – MotiveWave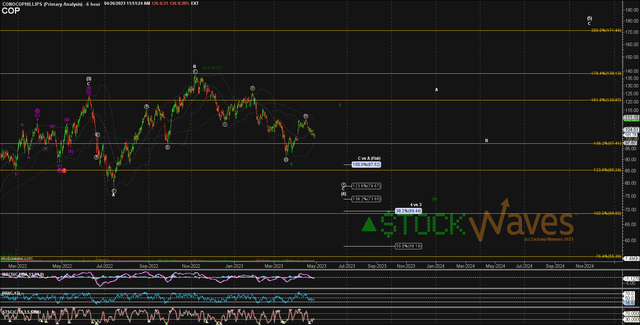
COP finds itself in a similar posture as compared to APA.
Risks
As you can see on the charts presented above, there also are some alternate paths possible. You will know from viewing our work shared in these articles that we look at the markets from a probabilistic stance. This means that we will identify which path is the most likely. But we also will point out an alternative road should the primary not play out as planned.
This is not to put forth so many paths that one will be right and we will declare ourselves victorious with our projections. Avi Gilburt has compared this to a general drawing up battle plans with a preferred path and a contingency so as to not be surprised. It’s only prudent to have more than one plausible path and then adapt to what the market gives us.
So, the risks here are that this pullback/consolidation period may last longer than anticipated. Also, if APA were to break strongly below the $24 level, it would be cause for reassessment. A similar key level for PXD is at the $150 area. And should COP fall under $68-$70 we would revise our current opinion.
Conclusion
You can see from the bigger picture charts that the structure of price projects much higher from current levels. That’s where we could see the possible doubling of share prices in these three names.
Markets are fluid non-linear and dynamic in nature. Elliott Wave analysis gives us powerful tools that provide context to the bigger picture and high-probability turn points along the way. We have published many articles that are available to the readership in which we describe in detail the why and how of our methodology.
There are many ways to analyze and track stocks and the market they form. Some are more consistent than others. For us, this method has proved the most reliable and keeps us on the right side of the trade much more often than not. Nothing is perfect in this world, but for those looking to open their eyes to a new universe of trading and investing, why not consider studying this further? It may just be one of the most illuminating projects you undertake.
Read the full article here


