The Direxion Daily S&P 500® Bear 3X Shares ETF (NYSEARCA:SPXS) is a horrible long-term investment. Let’s get that out of the way from the start. Because of the way the exchange-traded fund, or ETF, is constructed, shareholders who don’t actively manage positions on a short term time frame will see their capital decay away. This is a concept that has been well covered in the past by other analysts on Seeking Alpha. However, when timed properly, going long SPXS shares can generate significant short term returns when the broader equity market corrects. I believe we are at the beginning of such a correction.
In this article, I’ll lay out why I believe the S&P 500 is due for a drawdown both technically and fundamentally. My expression of that thesis is a responsible position in SPXS. I’ll also detail my approach to the position and my timeframe for an exit.
Equities Are Due For a Correction
When I look at the fundamental setup for stocks, I see a myriad of factors that I believe will push equities lower. Those reasons include but are not limited to valuations, consumer health, the impending end of student loan forbearance, the likelihood of layoffs ramping up, and the attractiveness of short-term treasuries. Each of which take the bid away from stocks.
Nosebleed Valuations
One of the more eye-popping expressions of how overvalued the U.S. equity market potentially is would be the Wilshire 5000 to GDP ratio – famously referred to as the “Buffett Indicator.”
Buffett Indicator (Longtermtrends.net)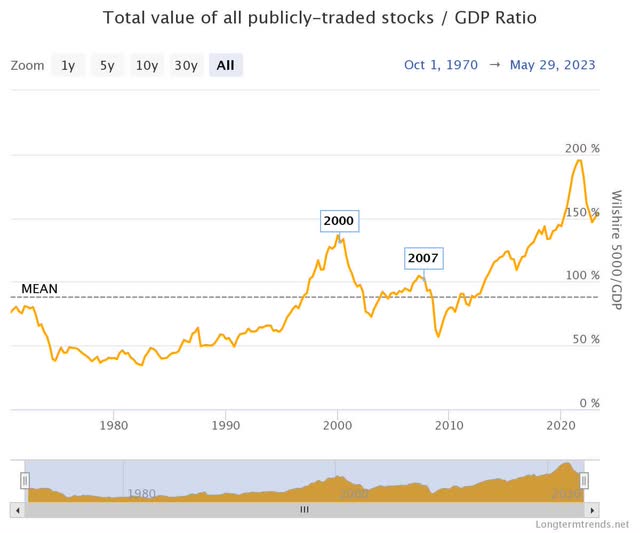
At 154%, the ratio is off the COVID/stimulus high of 198% in November 2021 but still well ahead of pre-GFC valuations. It’s even still ahead of the dot com bubble valuation which peaked in March 2000 at 141%.
S&P 500 to Bonds Ratio (Longtermtrends.net)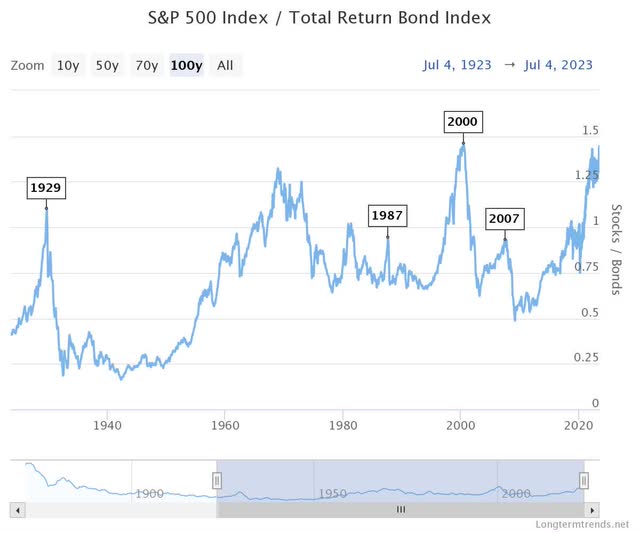
Another completely bonkers chart is the S&P 500 to Total Return Bond index, which is currently sitting at 1.44. Higher only one other time in the last 135 years; it was 1.46 in May 2000.
Consumer Health
Valuations remain elevated against norms at a time when the consumer may be getting closer to tapped out. Take, for instance, the move in credit card and revolving debt over the last two years:
Debt vs Saving Rate (FRED)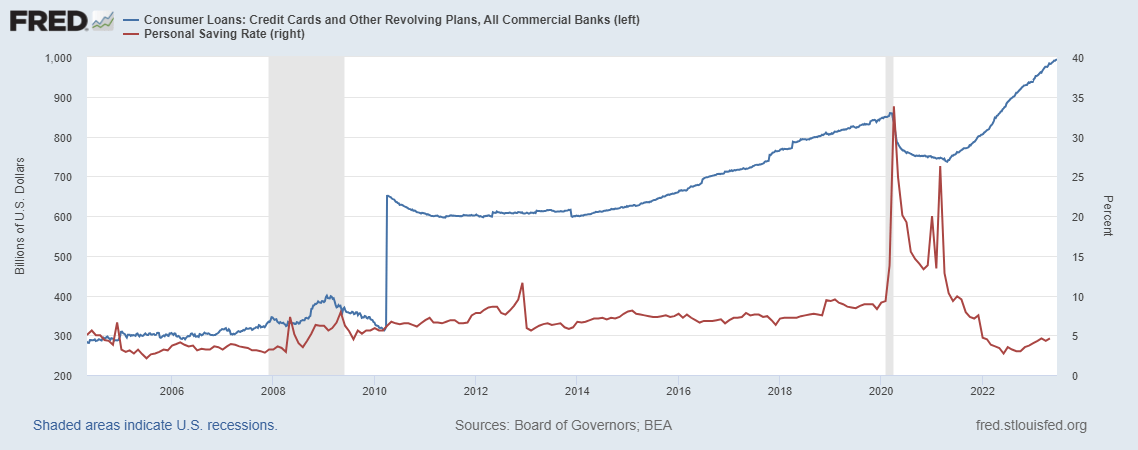
The average personal saving rate between 2010 through 2019 was 7.3%. 2020 was a notable outlier due to the response to COVID. Interestingly, the personal saving rate spiked from 9.3% in February 2020 up to 33.8% in April 2020. Stimulus certainly impacted trends in savings and debt outstanding during COVID. However, over the last 18 to 24 months, each of these trends in savings and credit card spending have changed dramatically. Since the beginning of 2022, the average personal savings rate has collapsed down to 3.8%. This is well below the pre-pandemic trend and more similar to GFC-era saving rates.
On the debt side, since bottoming out at $739 billion outstanding in April 2021, credit card and revolving plan debt has skyrocketed roughly 35% up to just over $994 billion in just two years. Taken together, it would appear as though consumers are unable to save and are instead turning to credit cards to make ends meet. At a certain point, the U.S. consumer can’t continue to spend borrowed money. Reduction in consumer spending means less sales of goods and services. Aside from borrow limits simply being reached, another potential catalyst is the end of student loan forbearance.
Student Loan Forbearance
It can always get worse.
What could actually make matters significantly worse for the consumer is the end of student loan forbearance later this year. In September, interest will begin to accrue again. Payments will be due beginning in October.
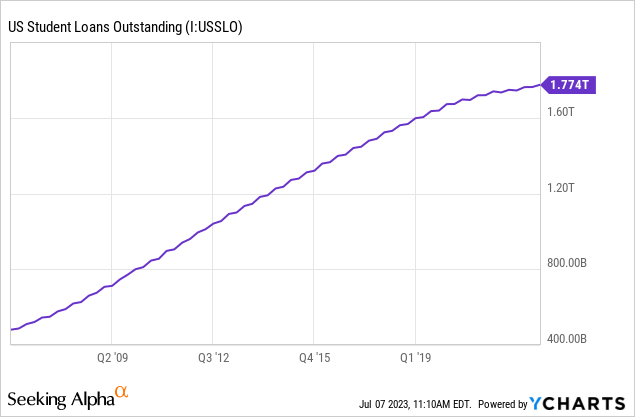
There is currently almost $1.8 trillion in student loan debt outstanding, and the average estimated monthly payment for borrowers is roughly $400. If these borrowers actually start trying to pay these loans back rather than waiting for another attempt at forgiveness from the current administration, there is little doubt that it will have an impact on broader consumer spending going forward. The impact on business and stocks will be negative. To be clear, I’m not personally advocating for or against student loan forgiveness, but I clearly believe honest repayment of these loans will have economic repercussions.
Jobs and Layoffs
And this gets us to the possibility of layoffs in the near future. The June non-farm payrolls number came in at 209k. This was under the 225k expectation and well below the 306k May revision. Interestingly, there was a 12% sequential spike in the number of people employed part time due to economic reasons. According to the BLS:
The number of persons employed part time for economic reasons increased by 452,000 to 4.2 million in June, partially reflecting an increase in the number of persons whose hours were cut due to slack work or business conditions.
In my view, that’s a bad sign, and not a reason to be terribly optimistic about stocks at these levels. We’re also seeing layoffs in tech continue:
Tech Layoffs by Quarter (Layoffs.fyi)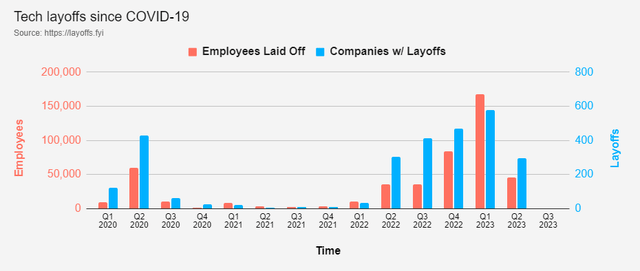
While the 45k tech layoffs from Q2-23 is actually a significant reduction from the 167k in Q1, Q2-23 layoffs were still up from the 35k in Q2-22. And according to layoffs.fyi, Q2-23 was the fourth-worst quarter for tech layoffs since the website started tracking the data at the beginning of COVID. According to the BLS, non-farm employees have continued to grow since the COVID crash, but there are concerning signs:
Nonfarm employee growth (FRED)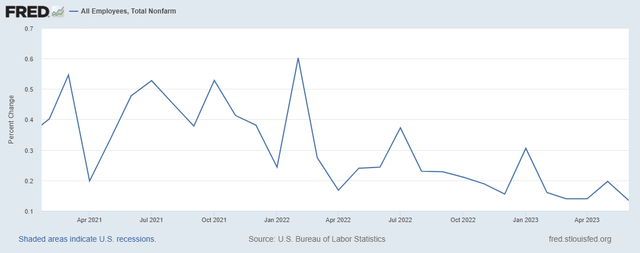
While it’s admittedly difficult to get a longer term sense of trend due to the COVID crash and recovery, what is clear is that total nonfarm employee growth has been slowing down since Q1 of last year.
Rising Yields
What also theoretically hurts the bull case for stocks up here is the activity in U.S. debt yields. With stocks looking toppy and possible economic concerns looming in the second half of this year, if the market is truly forward looking, I would expect a 5% risk-free rate in the form of a short term U.S. treasury to start looking pretty interesting by comparison.
US 10 year (TradingView)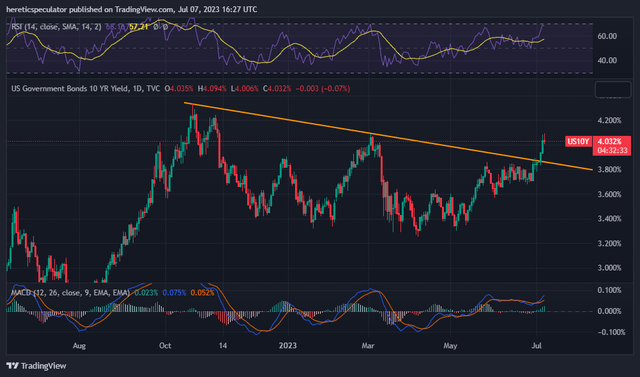
With the 10 year (US10Y) (chart above) appearing to break out and the 2 year (US2Y) now flirting with 5%, there is a strong incentive forming for rotation out of equities and into U.S. debt instruments.
Technical Justification
Switching gears briefly to the technical setup, there are signs in the daily chart that buying is getting exhausted. Looking at the S&P 500 (SP500), we see a bearish RSI divergence coupled with a MACD that foretells a shift in direction.
S&P 500 Daily (TradingView)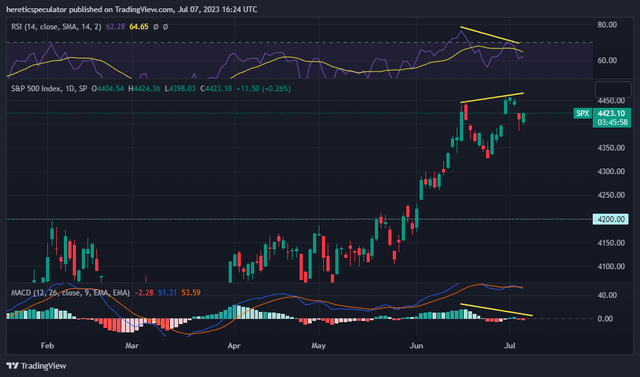
The SPXS chart is justifiably showing the inverse.
SPXS Daily Chart (TradingView)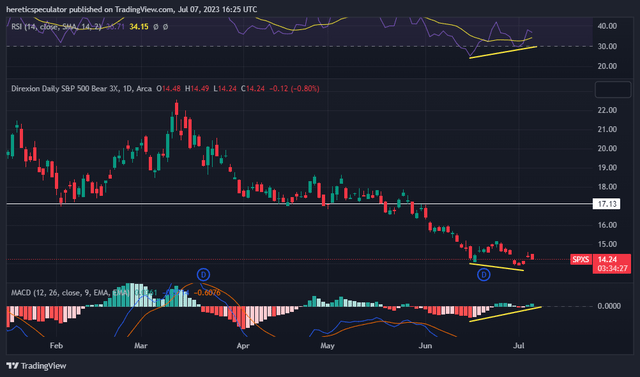
My approach to this trade is to allocate in small increments over the course of the next week or so. I’ve already opened my introductory long at $14.48. However, I’m not ruling out prices under $14 per share next week. In which case, I’ll be adding more to the position. I anticipate holding the shares through July and will reassess in early August.
Risks
As I mentioned at the beginning of this article, there is a tremendous amount of risk in a trade like this one. If I’m wrong and stocks continue to go up, SPXS goes down and I lose. If stocks go nowhere, I still lose because of the fund decay. Fellow SA contributor Fred Piard has done great work on this in the past, detailing why leveraged ETFs are poor long-term holds. Specifically pertaining to SPXS:
Since inception on 11/5/2008, SPXS has lost 99.98% of its value, through many reverse splits.
The reason these funds decay so rapidly is because they are rebalanced daily and are inherently risky due to the use of derivatives as the underlying assets in the funds. In the table below, you can see a hypothetical 6-day performance where the index is flat, yet the fund’s cumulative return is actually negative:
Rebalancing Effect (Direxion)
The point is, this is a bet on a countertrend move, and those are difficult to nail. I need stocks to go down immediately, or I’m not going to win this trade.
Closing Thoughts
In an environment like this one, I believe it makes quite a bit of sense to hedge exposure to equities. Cash makes sense. As do short term treasuries yielding 5%. While comparatively safe, neither cash nor treasuries offer a high reward for those looking to profit from a broad decline in equities. For tactical traders who want to generate greater returns from a broad market decline, shorting the market offers a higher risk/higher reward opportunity.
Because I have a personal aversion to margin trading or options, my preference is to try to time the inverse ETF when technicals and fundamentals align as I believe they do today. I like this approach better because I can’t get blown up by going short on margin if I’m wrong. Furthermore, I can simply take my remaining capital out of the cash account trade if I choose to throw in the towel. In my view, longing SPXS in responsible size is a useful approach to a diversified portfolio that includes cash, bonds, and various commodities. Going long SPXS is a bit more aggressive than a standard defensive portfolio, but given the fundamental and technical thesis I’ve laid out, I think it’s a solid speculative bet.
Read the full article here


