“A picture is worth a thousand words, but a chart is worth a thousand pictures.”
This is our motto. As visual learners, we value the power that charts wield for data analysis and interpretation. There is not a single investment decision that we make without the use of charts.
Today, we’re sharing two important charts that matter today and provide a little context about why they are so important.
Chart #1
Global Central Bank Assets
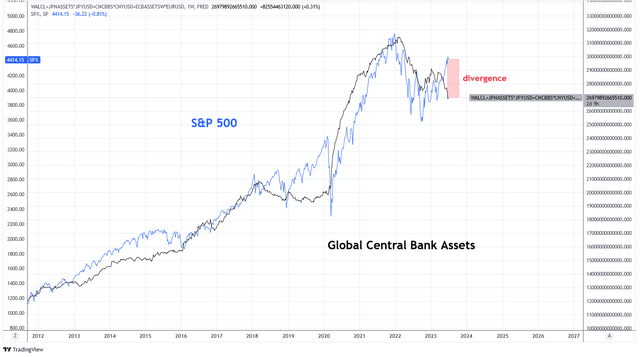
First, we have a chart that includes the sum of balance sheet assets for major Global Central Banks including the Federal Reserve (U.S.), European Central Bank, Bank of Japan, and Bank of China. The size of central bank balance sheets is one of the tightest correlations to liquidity and equity markets. Regression models indicate that the R-squared coefficient between the S&P 500 and global central bank assets is 0.98, suggesting a strong relationship.
Today, global central bank assets have taken a dive lower, below the previous low set in October 2022. With the S&P 500 (SP500) performing strongly as of late, this has created a significant divergence. Significant divergences of the past include 2015, 2018, and 2019, all of which resolved by equity markets catching down to assets until assets were expanded.
Charts by TradingView (adapted by author)
Chart #2
Regional Banks
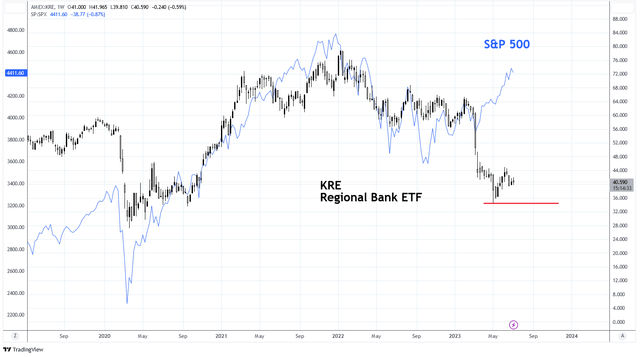
Regional banks have struggled in 2023. On March 9, regional banks, represented by the SPDR® S&P Regional Banking ETF (KRE), began crashing. The index is down 27% since then. The primary issue is unrealized losses in bonds on the banks’ balance sheets that are marked to maturity instead of marked to market. This doesn’t cause an issue until banks have liquidity issues and need to liquidate those bonds at a loss to meet depositor withdrawals. That scenario began to play out in early 2023 causing several large regional banks in the U.S. to fail.
In response, the Federal Reserve deployed a Bank Term Funding Program to provide temporary liquidity to banks by offering loans at par value to the banks for qualifying collateral including many of these marked to maturity assets. At the time, it was much debated if this program was effectively quantitative easing or not. Clearly, it seems that it was QE because equities have responded strongly in response, as can be seen in the chart below when the S&P 500 rose dramatically in the wake of the KRE collapse. After experiencing some recovery, the regional banks are again experiencing share price weakness. A breach of the low from May would be a very negative sign for the banking sector.
Charts by TradingView (adapted by author)
Conclusion
As usual, liquidity matters most. After a brief reprieve from shrinking their balance sheets, central banks have begun decreasing their assets once again. As long as another crisis in financial markets is avoided, such as when regional banks began to fail due to liquidity issues, we expect the trend of asset decline to continue. If regional banks begin to show signs of distress again, that will be a sign to keep an eye on liquidity that may be necessary to support financial markets.
Read the full article here


