Introduction
Healthpeak Properties (NYSE:PEAK), is a Colorado-based entity that is noted for its management of healthcare real estate across the nation. This year, the PEAK stock hasn’t fared too well, delivering negative returns of over 15% even as the SPDR Dow Jones REIT ETF (RWR) managed to eke out positive returns of close to 7%.
YCharts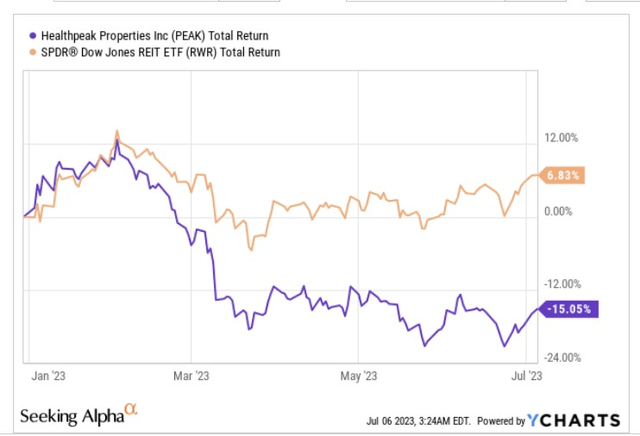
PEAK may not be the best REIT pick on offer, but we certainly don’t believe it is a washout and feel it could generate decent alpha at these levels.
Investment Case
Even though PEAK’s portfolio includes both MOBs (medical office buildings) and CCRCs (continuing care retirement communities), we particularly like its strong exposure to the life sciences segment, which accounts for half of its NOI (Net Operating Income).
AR 2022
The secular tailwinds surrounding the life sciences segment continue to burn bright and this should ensure long-term demand for PEAK’s properties; the US is aging at a rapid pace (by the end of this decade, we could have 69m baby boomers who will likely press the pedal on further healthcare spending) and this will call for greater impetus on drug development.
June presentation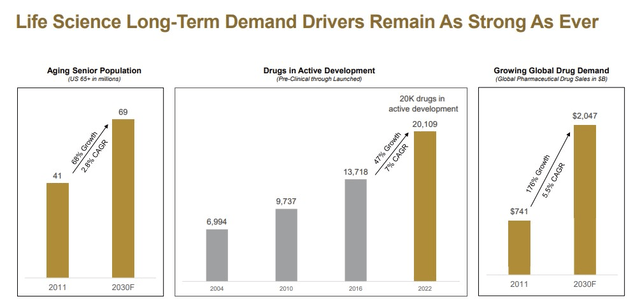
Admittedly, in some quarters, life sciences may be construed as a volatile and unsteady terrain (at the end of the day, it’s not as though every drug candidate will get through to the finish line, and procuring long-term funding can always be a challenge), but we believe these specialized properties (life sciences properties typically have higher floor loads than officer properties, and generally require more complex HVAC and electrical systems), that PEAK operates will almost always have plenty of takers.
For context, note that PEAK’s life sciences portfolio typically has occupancy rates of over 90% (currently the occupancy rate stands at 98%), and its lease roll is quite minimal. This has been the foundation of healthy same-store growth of over 5.5% over the last 8 years or so. Interestingly enough, in Q1, same-store growth for PEAK’s life sciences portfolio came in at a superior rate of 6.3% (consequently the FY23 expected same-store sales growth for PEAK was boosted upwards by 25bps)! This was largely driven by useful rent escalators (investors should note that besides the volatile CPI escalators, PEAK also puts in place fixed escalators that typically work out to 3%).
If a REIT can ensure such high occupancy and also bring through healthy same-store growth, it reflects well on the quality and texture of the clients that PEAK gets involved with.
Firstly, note that its life sciences portfolio is dominated by the who’s who of biotech (Amgen, J&J, Pfizer, etc.) with publicly listed large-cap names accounting for 28% of the total share. These firms have typically robust balance sheets and have the necessary staying power to withstand pressures across different economic cycles.
Then beyond the top 5 tenants, no single tenant accounts for more than 1% of PEAK NOI, reiterating the degree of diversification you get with this story.
June presentation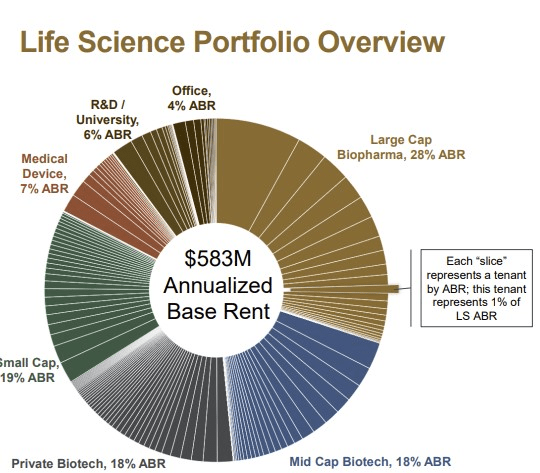
Also note that 75% of PEAK’s portfolio consists of publicly listed names, giving them a less onerous route to procuring capital. It is preferable to a client base of this sort, rather than get wedged with fledgling entities that are often dependent on VC flows that appear to be on a declining trajectory since last year. Cushman & Wakefield suggests that similarly weak trends will be seen this year as well.
Cushman & Wakefield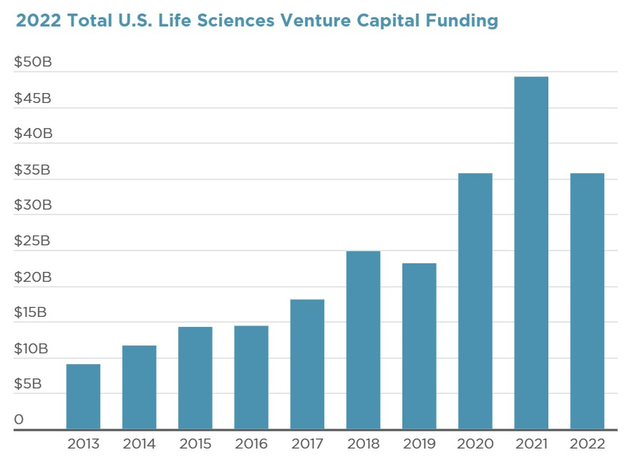
However, note that on the equity side, things appear to be progressing well. PEAK management mentioned that in Q1, there were around 30 follow-on offerings by biotech firms to the tune of $4.5bn, and around 22% of that came from PEAK’s clients. These recent bouts of capital procurement from the equity markets reflect well on the client’s financial health.
We also appreciate PEAK for its credit profile (investment grade rating by Moody’s and S&P) and don’t foresee any major financial encumbrances in the near future. The company’s floating rate exposure stands at a miserly 5%, and the image below highlights how it doesn’t need to fret over sizeable bond maturity payments for the next two years.
June presentation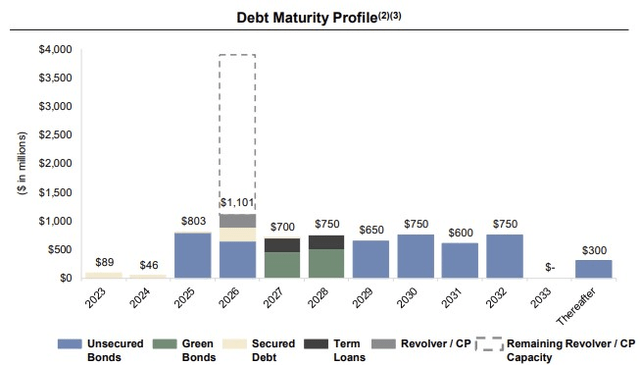
Forward Valuations And Yield
To get a sense of PEAK’s valuation quotient, we’ve compared it to 5 of the biggest (by market-cap) US healthcare REITS around; what we can see is that on a P/FFO basis (using FY23 estimates), the stock is currently available at a ~11% discount to the peer set average.
Seeking Alpha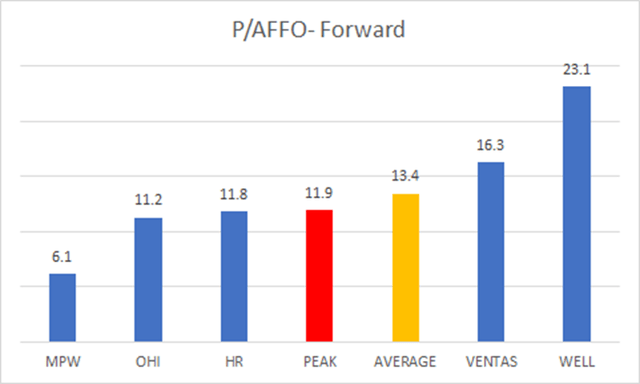
Prima facie that’s encouraging to note, but also do consider that back in late April, PEAK management had made tweaks to their original FFO guidance for the whole of FY23 (the erstwhile range of $1.7-$1.76 was lifted to $1.71-$1.77).
Despite lifting the guidance, you’ll still only be getting mid-single-digit FFO growth (consensus is currently at $1.74, and even if PEAK hits the high point of the guidance range, growth will still only come in at 6.6%). For context, only MPW offers a lower FFO growth trajectory for this year. In light of the relatively underwhelming FFO picture, it makes sense that PEAK is priced at a discount to the peer set.
Seeking Alpha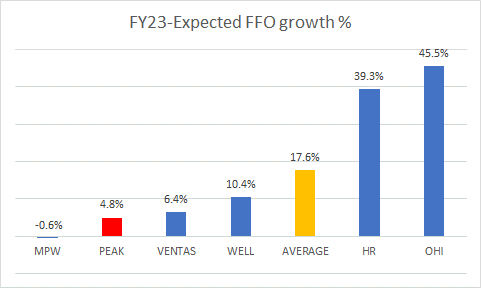
Then, PEAK may have cut its dividend in 2021, but despite that note that at the current price levels, the forward yield of 5.83% is still over 120bps better off than the 4-year average. Currently, only MPW offers a better yield differential relative to its historical average.
Seeking Alpha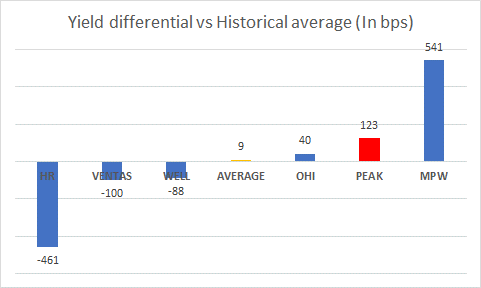
Closing Thoughts – Technical Considerations
We like what we see on both PEAK’s long-term chart, as well as its relative strength chart.
PEAK’s long-term monthly chart highlights how the price action has been taking place within a descending channel since peaking over 10 years back. No one is suggesting that PEAK is quite ready to re-test those highs, but we do believe prospects for some upside have picked up, given where the stock is currently (the last time it dropped to the sub-20 levels during the COVID sell-off it bounced from there). If one uses the two boundaries of the descending channel as signposts, it appears that the risk-reward for a long position looks very favorable at this juncture.
Investing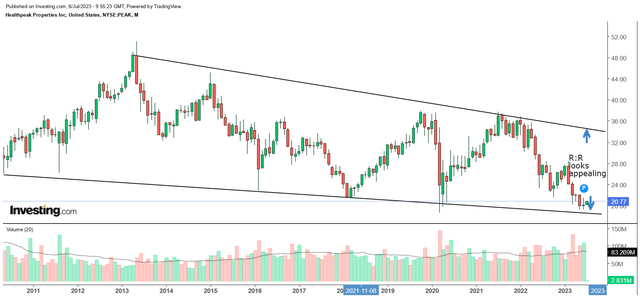
The long case is further supplemented by how oversold PEAK looks relative to its peers from the REIT space (as represented by the SPDR Dow Jones REIT ETF). Not only is the current relative strength ratio around 38% lower than the mid-point of the long-term range, but it has also dropped to levels last seen in 2006, from where there was a bounce.
StockCharts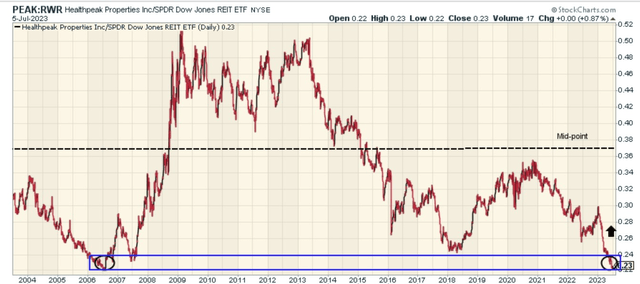
Read the full article here


