In our February 2023 article (here), that last checked on the economic screws, we stated…”The only serious threat to the economy (and the stock market) in the next 6 months is the politics around the insane ‘debt-ceiling’.” Now that the threat of economic suicide (debt ceiling) is gone, we report on the current state of the economic screws that hold the economy together,
The Screws Holding the Economy Together
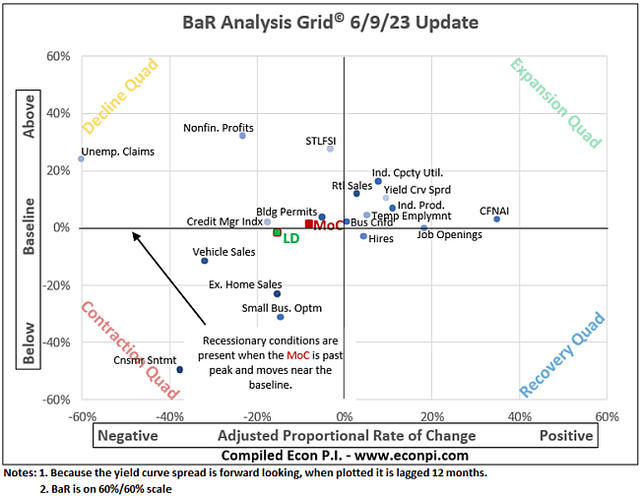
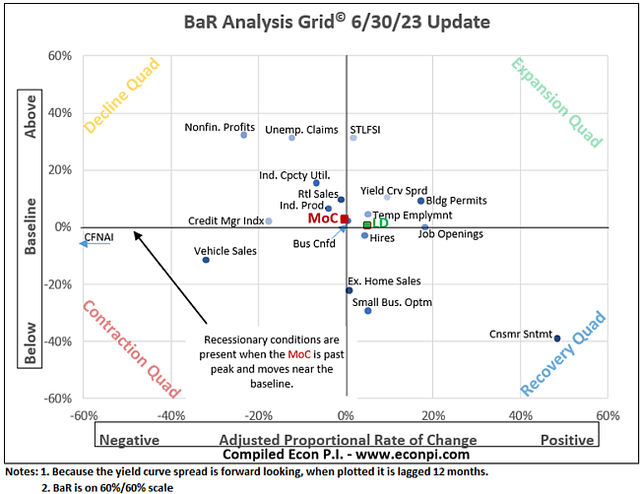
The first chart below is the BaR grid (from econpi.com) for June 9, 2023, and the second chart is the most recent chart dated June 16, 2023.
econpi.com
econpi.com
Notice that both the LD (leading indicators) and MoC (mean of coordinates) have moved back into the expansion quadrant. This means that the average of economic measures are, once again, starting to show economic growth. This screw is no longer loose, and progressively getting tighter.
The GDPNow estimate of Q2 2023 is averaging 2%. This screw is ‘tight enough’ (chart below).
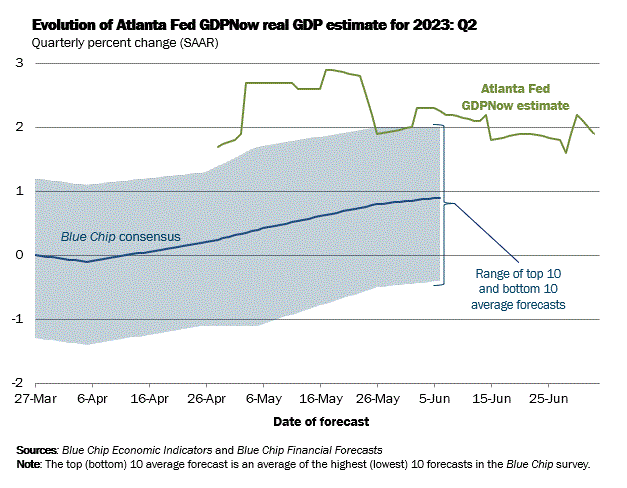
GDPNow
Industrial Production of the United States increased 0.2% y-o-y in May of 2023, matching the smallest increase since the pandemic recovery started in 2021. Although the rate of increase is low, industrial production does continue to increase. This screw remains tight enough, but just barely (chart below).
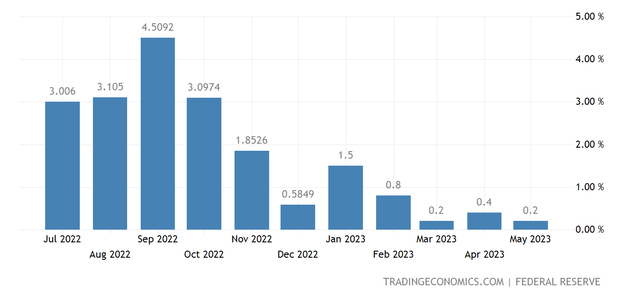
tradingeconomics.com
Capacity utilization either stalls or drops ahead of recessions. However, it is a necessary condition, but not sufficient for a recession; no recessions resulted following the drop in capacity utilization of 1985, 1995, and 2015. Capacity utilization has been increasing (green marking below) making this screw tight enough.
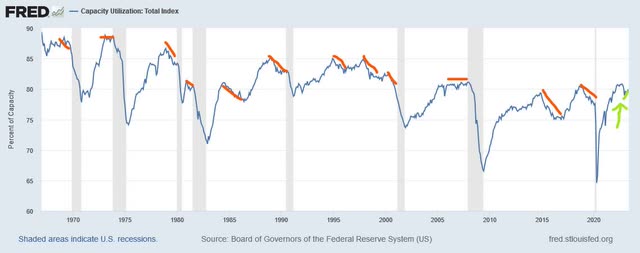
FRED
PCE (personal consumption expense), which is the Fed’s preferred gauge of inflation, has been trending lower all year. This screw is tight enough (chart below).
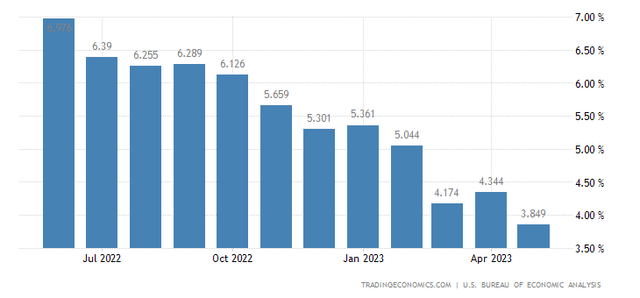
tradingeconomics.com
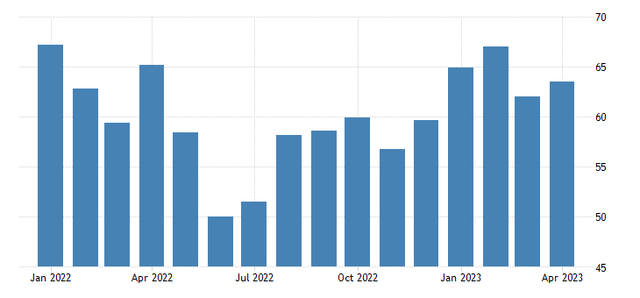
The University of Michigan consumer sentiment for the US has been trending higher for more than a year. This screw is tightening.
tradingeconomics.com
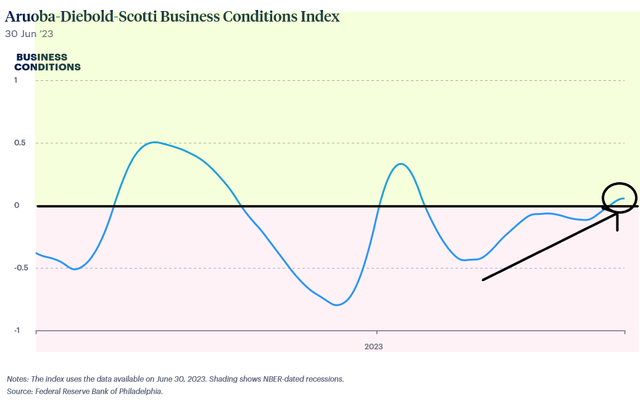
The Aruoba-Diebold-Scotti business conditions index is designed to track real business conditions at high frequency. The average value of the ADS index is zero. Bigger positive values indicate progressively better-than-average conditions, and bigger negative values indicate progressively worse than average conditions. The index shows that business conditions have improved and are above average which makes it a tight economic screw (chart below).
Phili Fed
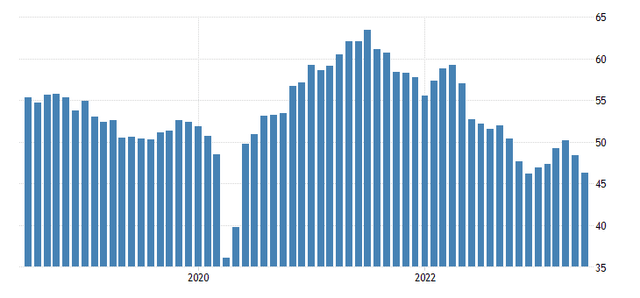
Manufacturing PMI for the US has decreased the past 3-months and has been in a protracted fall from mid-2021 levels and is below pre-COVID levels. This screw is loose.
tradingeconomics.com
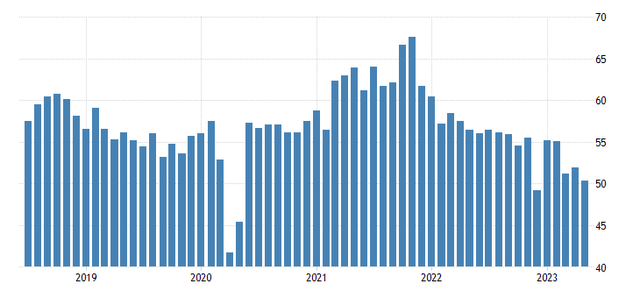
Non-manufacturing PMI has been trending lower since 2021, but is still above 50 which means it is still growing. This screw is tight enough, but is loosening.
tradingeconomics.com
Banks tightening lending-standards always precedes recessions, but tightening lending-standards does not always lead to recessions; e.g. 1994-1999 and 2014-2016. The tightening of lending-standards seems to be leveling off, but what is clear is that lending standards are raised when the FFR is raised, and recessions happen only if rates get too high for the economy to cope. At the moment, it is unknown if the Fed will go too far, which means this screw is loose.
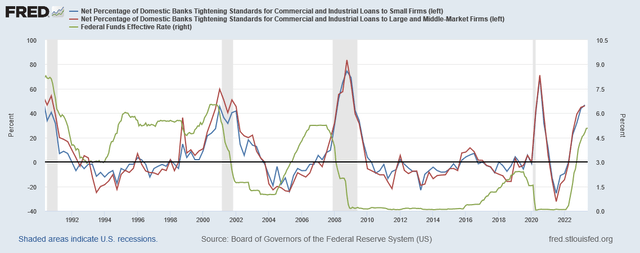
FRED
However, recessions occur when both lending-standards and delinquency-rates are rising. At the moment, delinquency-rates are at low levels and not rising (green highlight below). This screw is tight.
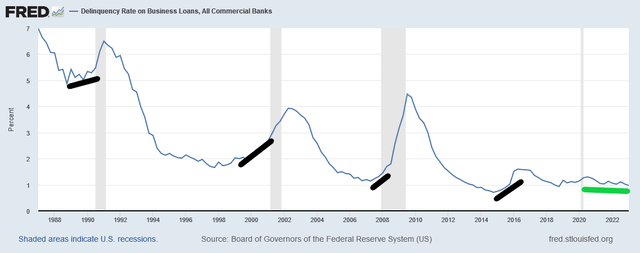
FRED, ANG Traders
Household debt service as a percent of disposable income Is just above historic lows and going lower. This is a tight screw.
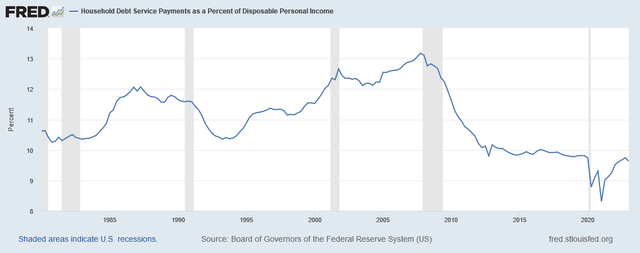
FRED
Recessions are always preceded by at least one-year of falling housing starts. Housing starts had been falling for 12-months, but spiked 22% higher in May. This screw is loose. but starting to tighten rapidly.
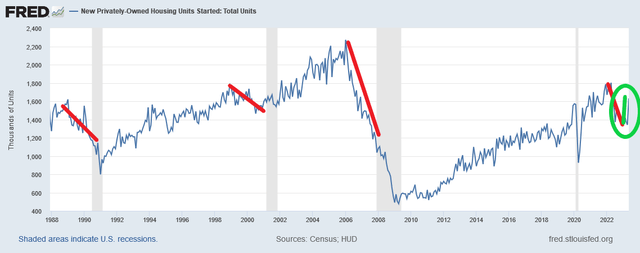
FRED, ANG Traders
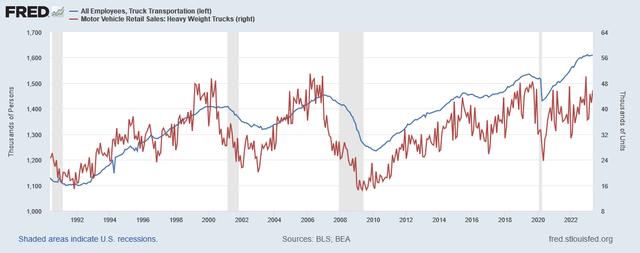
Truck transport employment stops growing or declines and heavy truck sales collapse for more than a year ahead of recessions. Truck transport employment is at all-time highs and truck sales, while below ATH, are above the long-term average. This continues to be a tight economic screw.
FRED
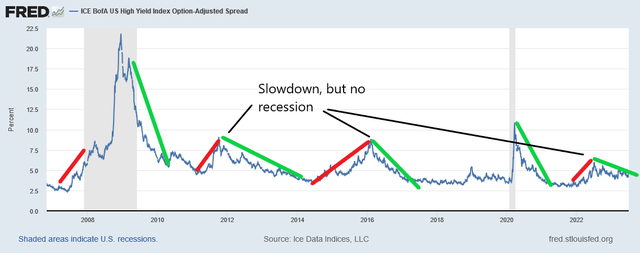
The BofA High Yield Spread Index rises as economic conditions worsen (red indications), but not every rise results in a recession. Currently, the High Yield Spread Index is signaling an economic recovery (green highlight below). This is a tight screw.
FRED, ANG Traders
The Most Important Screw
The fiscal response to COVID produced a post-WWII record government budget-deficit (private-sector surplus) which prevented a depression. The net-transfer (spending minus taxation) to the private-sector was +$2,908B in fiscal 2021. But in April and June of 2022, taxes drained ~$400B and ~$125B, respectively, from the private sector, and a return to pre-COVID spending levels produced a net-transfer of only +$1,166B; a nearly-2/3 reduction in private-sector surpluses which caused economic and stock market weakness in Fiscal 2022 (Treasury fiscal year-end is September 30).
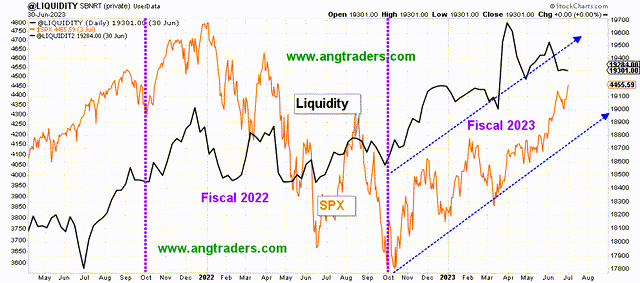
So far, in fiscal 2023 (which started October 1, 2022), the net-transfer has been +$1,200B, compared to a mere +$714B at the same time last year. That means that the net-transfer rate is running 68% higher than last fiscal year! It is virtually impossible to shrink the economy with that level of private-sector surplus. The positive effect of this increase in the private-sector surplus can be seen in our liquidity model and in the stock market (chart below).
ANG Traders, stockcharts.com
In conclusion, the balance of “economic screws” are tight, and now that the threat of economic suicide (the debt-ceiling) is over-with, and the fund-flows from the Treasure are running 68% higher than last year, it is highly unlikely we see a recession in the next 6-12 months.
Read the full article here


