REITs are normally a good inflation hedge. But in the current inflationary environment, this isn’t the case. This might change of course. We already took a look at REITs in general and high yielding REIT ETFs. In both cases we didn’t find something worth buying now. We continue our search and today we look at two actively managed REIT ETFs: the Invesco Active U.S. Real Estate ETF (NYSEARCA:PSR) and the iShares Cohen & Steers REIT ETF (BATS:ICF). The first is a real active ETF while the latter is deviating from the average REIT market by focusing on the largest and most liquid REITs.
Past performance
In the current inflationary environment commodities (including gold) and the ProShares Inflation Expectations ETF (RINF) are the best performing asset classes. Worst performer: US REITs…
Figure 1: Total return chart (Author)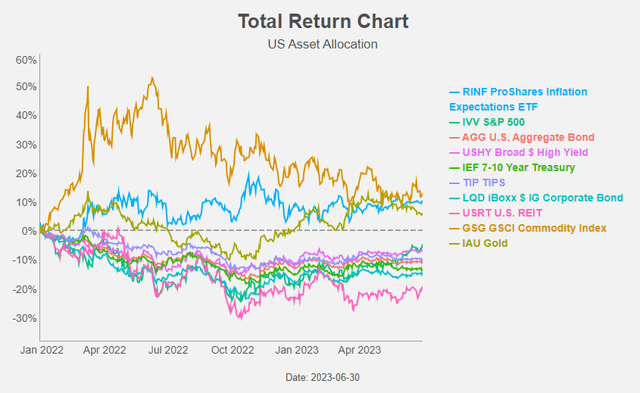
REITs are normally a good inflation hedge.
Figure 2: Real Estate and inflation (Cohen & Steers)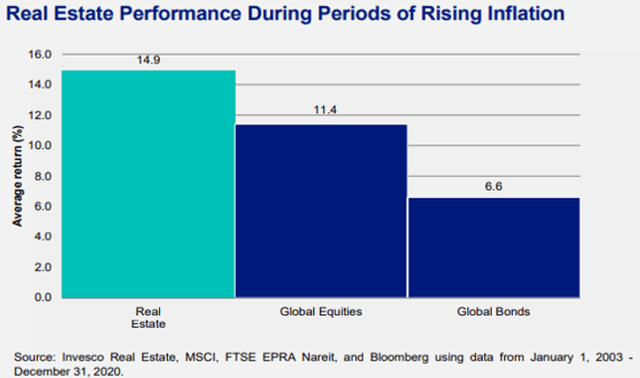
The above figures are of course an average. If we look more in detail to different past inflationary periods, we see that listed US real estate does on average indeed performs well when inflation is high. But this isn’t always the case. E.g. in 2009 REITs strongly underperformed.
Figure 3: Real Estate and inflation (Cohen & Steers)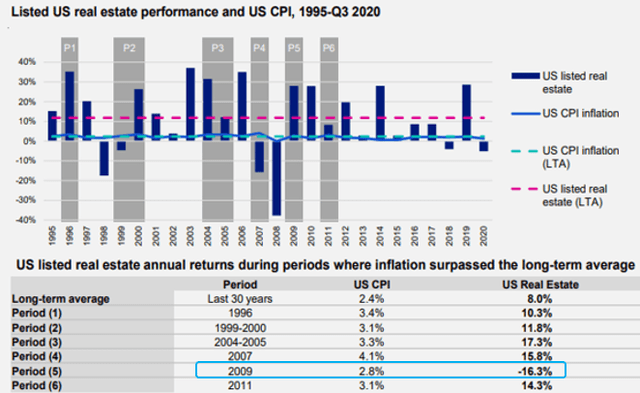
Economic growth is of course a key element. Real estate returns are often closely tied to economic growth. And periods of higher inflation are typically marked by higher economic growth, which in turn can drive increased demand for commercial real estate that enables landlords to push through rent increases. And currently the Fed is slowing down the economy with its rate hike campaign.
When we look at the past performance of PSR and ICF (in the period between Jan 2009 and Jun 2023) the performance is in line with each other and with the Vanguard Real Estate ETF (VNQ). PSR is however a bit more defensive with a lower volatility, a lower beta and a lower maximum drawdown.
Figure 4: Risk and return metrics (Portfolio Visualizer)
PSR uses quantitative and statistical metrics to identify attractively priced securities and to manage risk. PSR may take a temporary defensive position and hold all or a portion of its assets in cash if there are inadequate investment opportunities available due to adverse market, economic, political or other conditions. Doing so could help PSR avoid losses in the event of falling market prices and provide liquidity to make additional investments, but may also mean lost investment opportunities in a period of rising market prices. History shows that it certainly helped in achieving slightly better risk-adjusted returns compared to ICF and VNQ.
ICF is benchmarked to the Cohen & Steers Realty Majors Index. Other REIT indices like the FTSE Nareit All Equity REIT Index includes the entire universe of REITs and, therefore, contains also many illiquid REITs. The same goes for the MSCI and Dow Jones REIT indices.
Figure 5: REIT indexes (Cohen & Steers)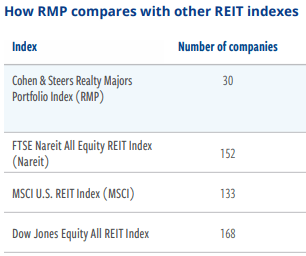
The Cohen & Steers Realty Majors Index wants to provide “a liquid, diverse representation of companies leading the real estate industry”. They only include those REITs that have experienced management teams and high-quality properties that, as a portfolio, provide property sector and geographic diversification.
Figure 6: ICF Sector allocation (iShares)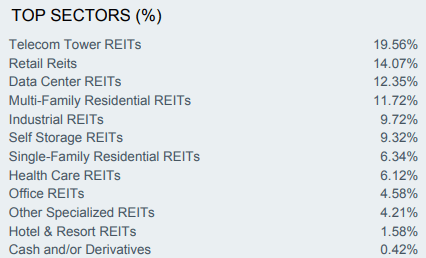
In comparison with ICF, PSR has a slightly higher weight in Industrial REITs and Shopping Centers. ICF has in turn a higher weight in Retail and Multifamily residential REITs.
ICF has only 30 REITs in portfolio and the weight of the top 10 holdings is bigger as a result.
Figure 7: ICF Top 10 holdings (iShares)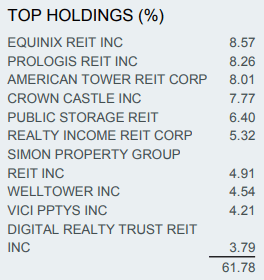
PSR has 80 REITs in portfolio and is hence better diversified.
Figure 8: PSR Top 10 holdings (Invesco)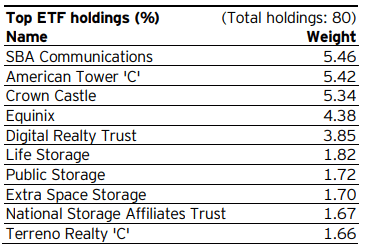
The expense ratio of both ETFs are in line with each other: 0.35% for PSR and 0.32% for ICF.
In what follows we will discuss the three main decision points we use to determine if we buy, yes or no, a REIT ETF: premium (or discount) to NAV, dividends and long term trend.
P/NAV
The book ” The intelligent REIT investor” by Stephanie Krewson-Kelly and R. Brad Thomas stresses the importance of REITs trading above NAV in the outlook for growth. When REITs trade above NAV there is a green light on growth and when REITs trade below NAV there is a red light on growth. Trading above NAV allows a REIT to issue new stocks to fund growth. If a REIT trades below NAV it’s advisable to shrink the portfolio and/or buyback shares.
Currently, REITs trade on average with a discount of 23% to NAV. This puts a break on the growth outlook for REITs.
Figure 9: REIT Premium/ discount to NAV (S&P Global)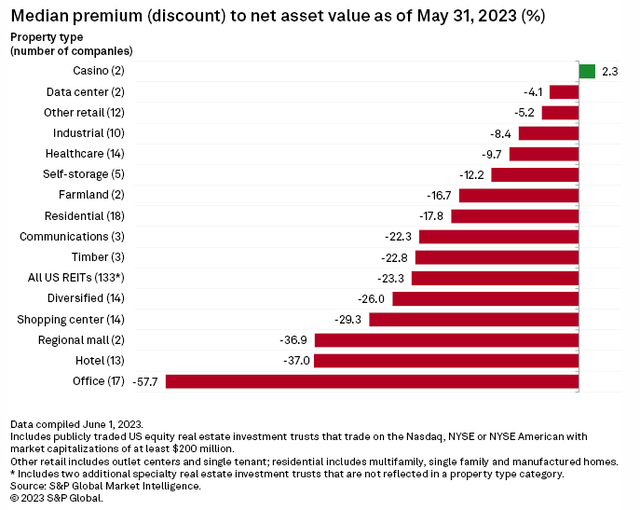
Cohen & Steers recently called the REIT fundamentals “resilient, but decelerating”. They lowered their growth expectations amid the slowing economic backdrop. They expect a lower than historical average for both this and next year.
Figure 10: REIT growth estimates (Cohen & Steers)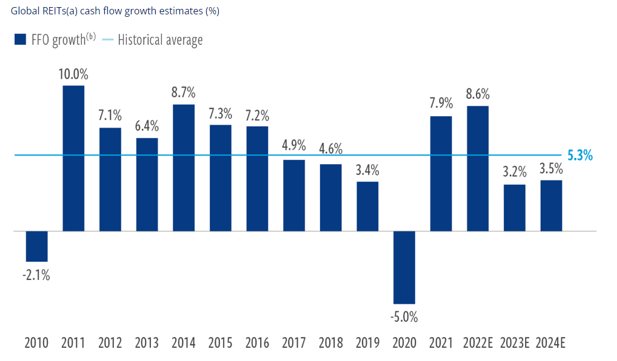
Both ICF and PSR trade at a smaller discount to NAV compared to the REIT average of 23%: PSR trades at a discount of 13% to NAV and ICF is at 11%. We will be buying REITs again when they trade at a premium to NAV.
Dividends
Research by S&P Global shows that REITs with a bad balance sheet trade at a bigger discount to NAV compared to REITs with a better balance sheet. The discount to NAV indicates that both the growth outlook and the balance sheet strength of PSR and ICF is better than the average REIT market. The risk of a dividend cut is hence below average.
The balance sheet figures confirm this. PSR and ICF have a debt/EBITDA ratio in line with the REIT average of 7.5. The debt ratios of PSR (31%) and ICF (28.5%) are better than the REIT average of 46%.
So the dividend safety of both PSR and ICF is ok, but what about the dividend yield. Is their yield attractive compared to treasury yields? The answer is no.
The dividend yield of both PSR and ICF is below 3%. In comparison, the dividend yield of VNQ is 4.5% and we consider this yield too low compared to treasury yields ta call VNQ a buy.
Figure 11: Dividend yield (Seeking Alpha)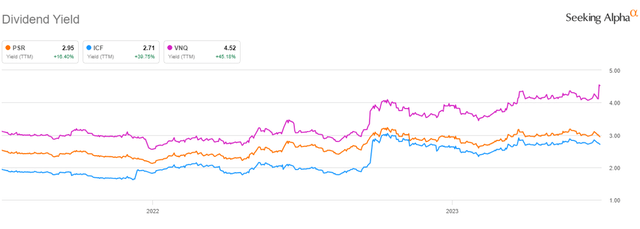
Trend
Both PSR and ICF are trading at a discount to NAV, while we will be buying REITs again when they trade at a premium to NAV. We are also buyers when the dividend yield is attractive compared to treasury yields, which isn’t the case for PSR and ICF.
The third point we look at to determine if a REIT ETF is worth investing in is the long term trend. Also here the conclusion is also negative: while PSR and ICF are no longer in a long term down trend, they still aren’t in a long term uptrend.
Figure 12: Trends (Author)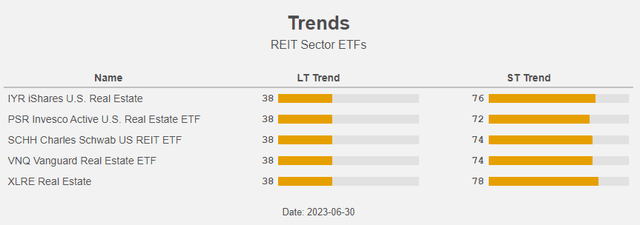
When the LT trend is clearly up, we get a green light/colour. Vice versa, when the LT trend is clearly down, we see a red light/colour. In between the colour is orange.
Figure 13: Total return chart (Author)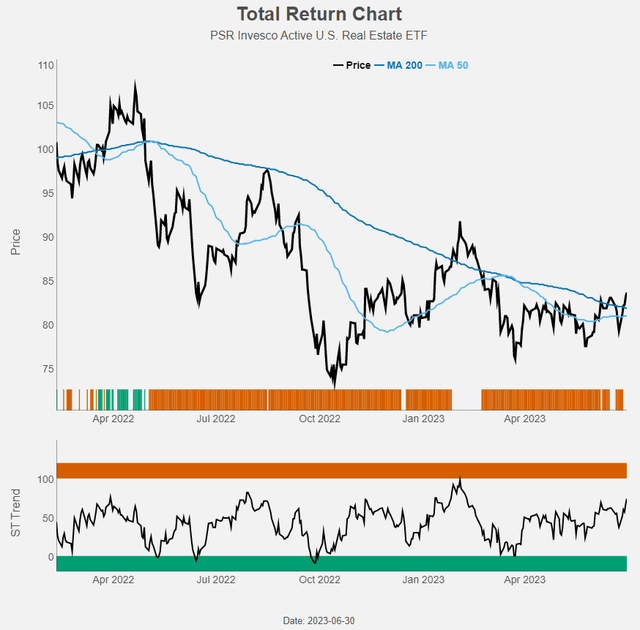
The ribbon in the price-part of Figure 13 shows the LT trend-colour through time, while the lower part of the chart shows the ST trend. We left out the orange colouring to avoid overloading the chart. It’s only recently the long term trend turned from down to neutral.
Conclusion
Both PSR and ICF are quality REIT ETFs. They have higher growth prospects and their balance sheets are in better shape than the average REIT. But this quality comes at a price: a low(er) dividend yield.
As they are still trading at a discount to NAV and not in a long term uptrend, we’re not buyers of these ETFs for the moment.
Read the full article here


