I have mentioned Barrick Gold (NYSE:GOLD) as an intelligent precious metals mining choice over the last year. I like it because of a diversified resource and production profile across the planet, lower-than-normal historical valuations, plus substantial upside “leverage” to gold/silver/copper prices. The company ranks as one of the largest global producers of precious metals each year.
Another bullish reason that gets less attention is its balance sheet setup has become vastly more conservative vs. a decade ago, which should allow a rising trend in precious metals prices to flow directly to better cash flow and earnings. In turn, I expect the stock quote to climb faster than witnessed during previous gold swings higher 5-10 years ago. For example, a Barrick +30% price increase five years ago may play out as a +40% or +50% move during the rest of 2023 and 2024, a subtle but important difference supported by its stronger balance sheet.
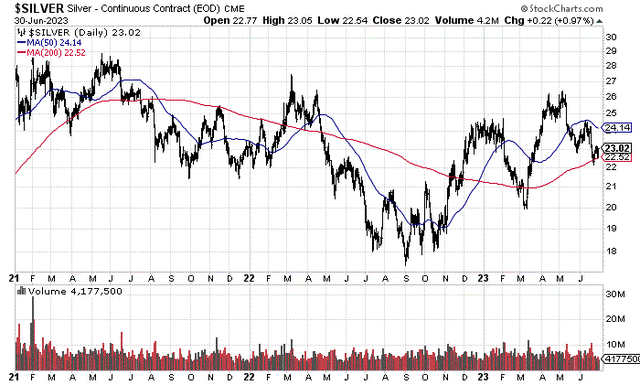
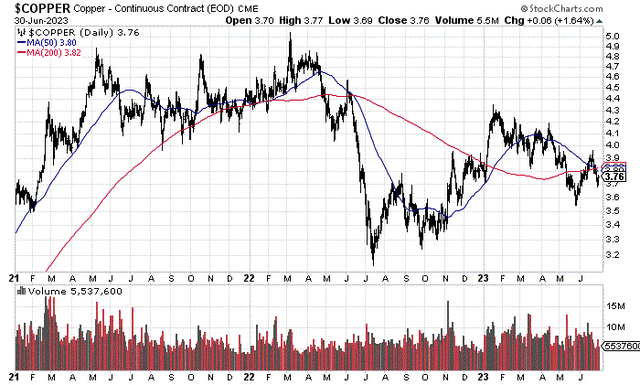
Other variables I like today include a rising trend in precious metals pricing since November that is being ignored by the majority of investors and analysts on Wall Street, plus a short-term stock trading setup that is hinting at better days ahead.
StockCharts.com – Nearby Gold Futures, Daily Price & Volume Changes, 30 Months StockCharts.com – Nearby Silver Futures, Daily Price & Volume Changes, 30 Months StockCharts.com – Nearby Copper Futures, Daily Price & Volume Changes, 30 Months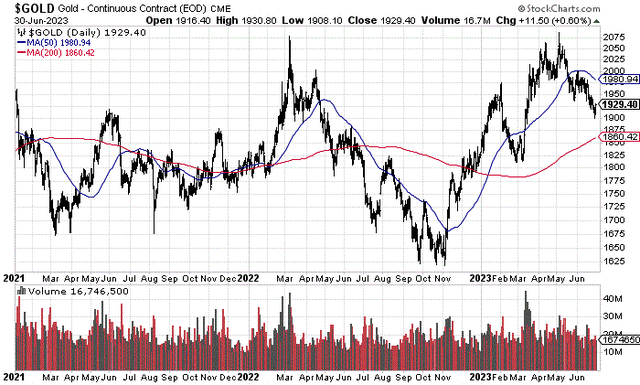
Deleveraged Balance Sheet
The biggest positive change the company has made over the last decade has been to increase cash levels ($4.3 billion today), while paying off a tremendous amount of debt ($8 billion since 2013). This gives management smarter flexibility running the business, while reducing net interest expense dramatically (declining from $729 million in fiscal 2015 to $191 million over the latest four quarters). The end result, instead of worrying about capital expenditures and how to pay for them, investors can now focus simply on production levels and the selling prices for mined metals when valuing the business.
Below is a 10-year graph of total debt minus cash, creating a net financial debt number. For Barrick, net debt has declined from $13 billion in 2013 to just $400 million today. Again, taking working capital like cash, inventory and receivables, then subtracting all short-term debt, IOUs due in the coming months, and accounts payable, we find a working capital total. Total long-term liabilities minus working capital gives us a useful number for net liabilities on the balance sheet (without even looking at long-term investments or plant & equipment). Falling from $18 billion in 2013, net liabilities minus working capital is just $6.3 billion today. Either way you look at it, Barrick has paid off a good $12 billion in net-of-cash liabilities over ten years.
YCharts – Barrick Gold, Net Financial Debt & Net Long-term Liabilities, 10 Years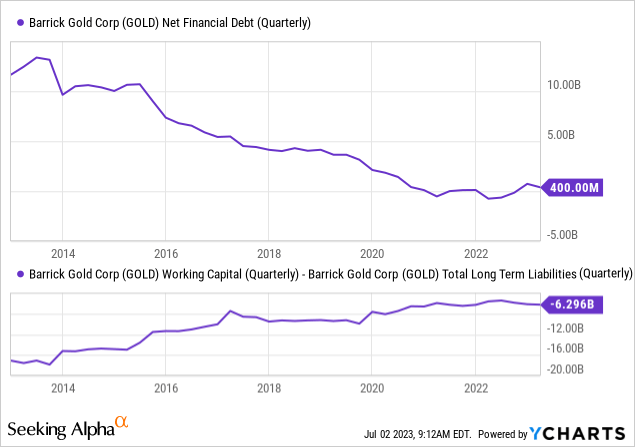
Tangible book value has benefited materially from the debt reduction effort. The bump higher in gold and precious metals during 2019-20 allowed the company to further recapitalize its balance sheet with less debt and more net hard asset value. At $19 billion, the tangible book value number is quite strong vs. almost no net debt in the middle of 2023. The equity market capitalization under $30 billion at $16.93 per share is trading at a minimal premium of 1.5x net hard asset value, using standard accounting and depreciation practices.
YCharts – Barrick Gold, Market Cap vs. Cash Holdings & Tangible Book Value, Since 1993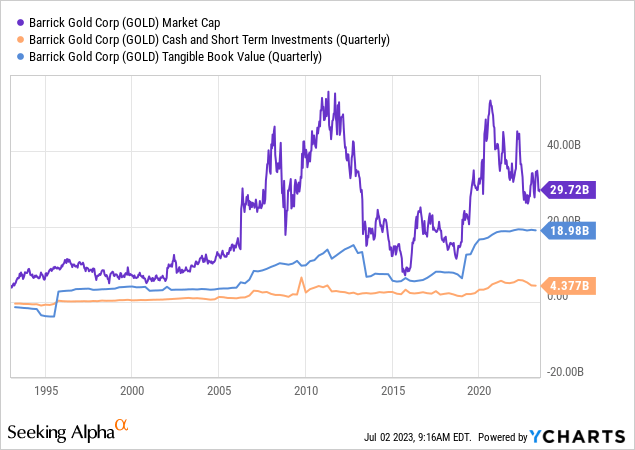
The 1.5x tangible book value multiple is quite low historically. Honestly, this ratio seems too low, given net debts have been reduced to almost zero. Lower price to book value numbers in 2013 and 2016 were accompanied by much higher debt levels and financial risk. You have to go back to the all-time lows of 2001 for Barrick of 1.3x tangible book value to find a similar value setup on accounting worth. This period also marked the modern price bottom for gold bullion around US$275 an ounce. To me, being able to acquire Barrick at 1.5x tangible book value is a serious bargain vs. its long-term average of 3x.
YCharts – Barrick Gold, Price to Tangible Book Value, Since 2000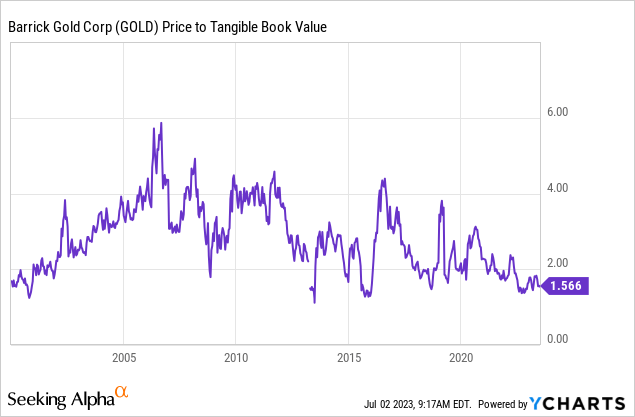
Other valuation yardsticks are sitting at lower-than-normal positions also. P/E ratios around 20x are on the low end of the historical range, with 26x a long-term average for Barrick Gold.
YCharts – Barrick Gold, Price to Earnings Ratio, Since 2000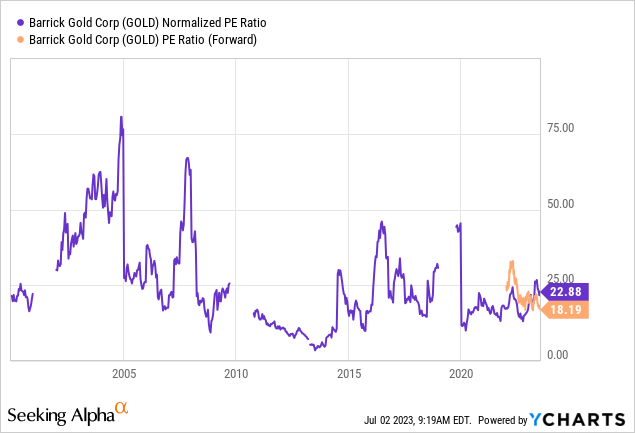
When incorporate high cash levels and lower-than-usual debt, enterprise valuations are even cheaper. EV to EBITDA of 10x trailing results and 7x forward estimates by analysts compares to long-term averages closer to 12x.
YCharts – Barrick Gold, EV to EBITDA, Since 2000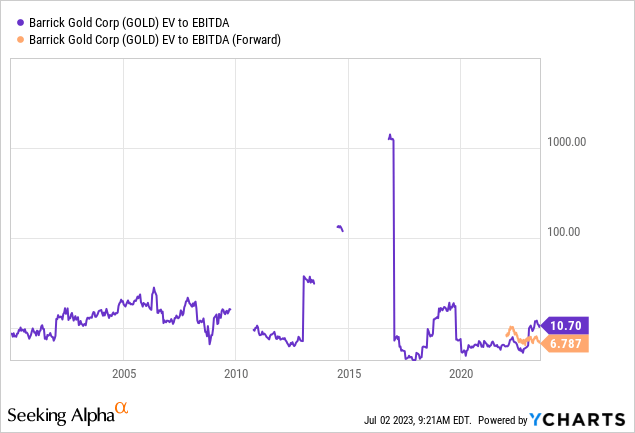
EV to 2023 sales ratios are hovering around 3.4x (3.6x trailing vs. 3.2x immediate forecast), which is far below Barrick’s long-term average of 5x.
YCharts – Barrick Gold, EV to Revenues, Since 2000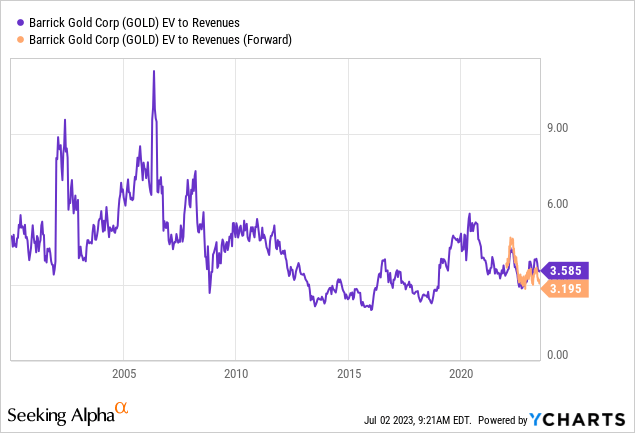
Final Thoughts
The overall technical trading picture for Barrick has been moving in the right directions since the November bottom in precious metal assets. Specifically, over the past week, the 20-day Chaikin Money Flow indicator has been highlighting a strong turnaround in trading action. I have boxed the bullish CMF change below in gold. This sharp reversal in buying interest since early June could be a signal of rising share price soon. Previous patterns in the CMF construct have coincided with price bottoms since 2021 (gold arrows). If history repeats (or at least rhymes), Barrick could trade at much higher quotes a few months out.
StockCharts.com – Barrick Gold, 30 Months of Daily Price & Volume Changes, Author Reference Points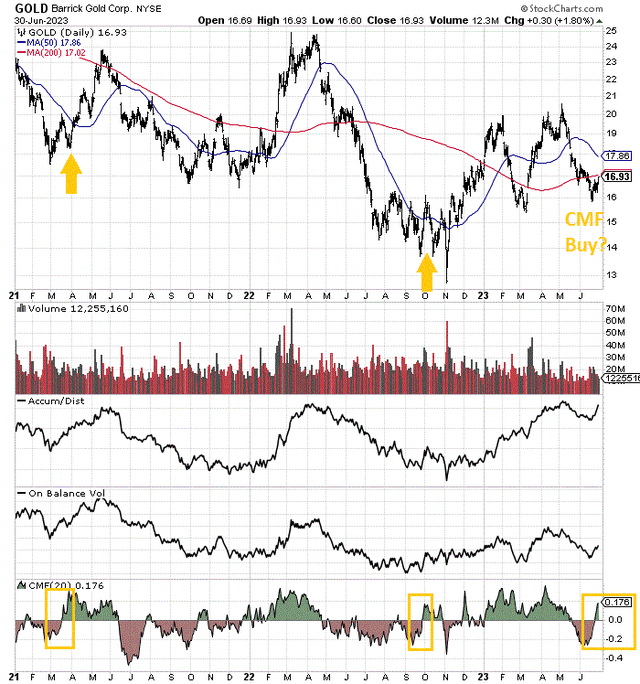
I have been explaining the upside potential of gold and silver in particular for several years, pointing out the relative prices for both are quite low historically vs. the explosive growth in M2 money stock and Treasury debt since the pandemic began. As the monetary metals hedge money printing and debt creation, the lack of much movement net-net since February 2020 means the two metals are being pressed back in a coil-like compression, which will almost surely allow a major springboard for price once the Federal Reserve “pivots” to easy money as the 2023 recession appears (my base forecast from tightening credit conditions and a still wickedly inverted Treasury yield curve).
I have a “fair value” number for gold approaching US$3000 an ounce today, using relative ratio analysis to money aggregates, equity prices, real estate prices, and other commodities. Silver’s worth as a long-term average on similar constructs is around $40 an ounce currently. So, if/when the Fed waves its white flag on fighting inflation, and instead decides preventing a serious recession is more important a task, precious metals have tremendous upside potential already built into the investment story.
One way to take advantage of the approaching bull run in gold and silver, plus the racing electric-vehicle demand for copper, is to own a blue-chip conservatively positioned miner like Barrick, with decades of existing economic reserves, plus resources ready to be developed on higher metals quotes.
What’s the downside risk? Barrick does own a list of assets in less desirable jurisdictions and somewhat unstable political locations, which has generated headaches for management and investors on occasion. In addition, a stock market crash would be harder on miners than on bullion prices initially.
But, the overriding risk owning any metals miner is the selling price for production in the future declines appreciably. I am expecting the opposite. So, if my bullish forecast proves incorrect, a drop in Barrick of -30%, back to tangible value is theoretically possible as a worst-case scenario.
Seeking Alpha Table – Barrick Gold, Analyst Estimates for 2023-25, Made July 1st, 2023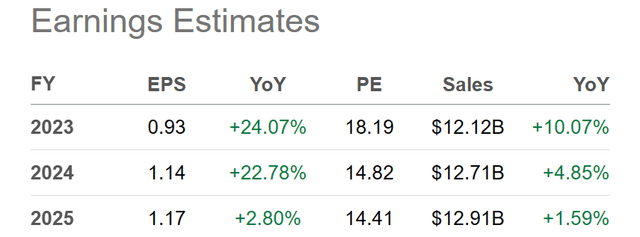
What’s the best-case upside argument? EPS of $1.50 to $2.00 are possible at $2500 gold, $30 silver, and $4 copper next year. With the improved balance sheet setup providing price support and some peace of mind, upside surprises in gold and silver could help Barrick jump to $25 to $30 a share (2.5x to 3x on “rising” tangible book value). $3000 gold, $40 silver and $5 copper might be able to support close to $50 for a Barrick quote, given a P/E of 20x income rates above $2.40 per share.
Downside risk of -30% vs. real-world reward potential of nearly +200% over the next 12-24 months (including the annual dividend yield of 2.4%) is heavily titling the investment equation in favor of bulls, from my research and experience trading precious metals for 37 years. I rate shares a Buy and am looking to re-enter a position next week. The Chaikin Money Flow reversal is playing a role in my swing-trader activities.
Thanks for reading. Please consider this article a first step in your due diligence process. Consulting with a registered and experienced investment advisor is recommended before making any trade.
Read the full article here


