This article was first released to Systematic Income subscribers and free trials on June 25.
Welcome to another installment of our CEF Market Weekly Review, where we discuss closed-end fund (“CEF”) market activity from both the bottom-up – highlighting individual fund news and events – as well as the top-down – providing an overview of the broader market. We also try to provide some historical context as well as the relevant themes that look to be driving markets or that investors ought to be mindful of.
This update covers the period through the fourth week of June. Be sure to check out our other weekly updates covering the business development company (“BDC”) as well as the preferreds/baby bond markets for perspectives across the broader income space.
Market Action
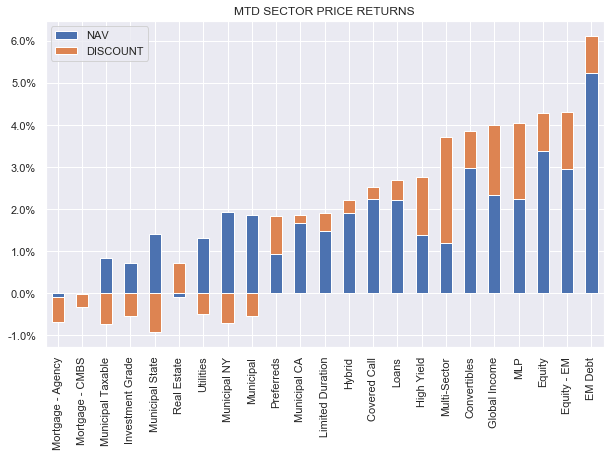
The CEF market was mostly down this week as broader markets cooled off after a strong run. Month to date, however, most sectors are still up.

Systematic Income
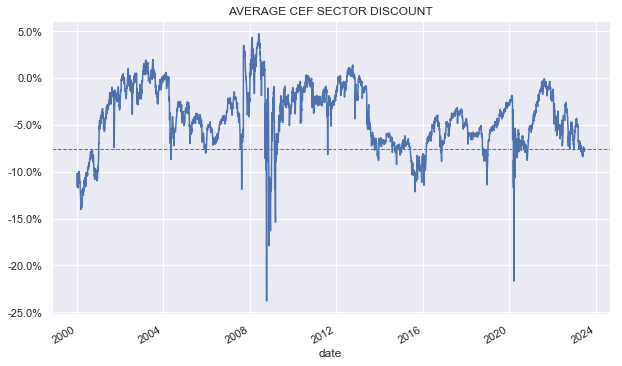
CEF discounts tightened slightly, however, they have been very sluggish. While the overall CEF space is up more than 10% off its lows late last year, discounts are not far off their wides.

Systematic Income
Market Themes
The CEF market remains popular with income investors. However, along with the popularity comes a fair dose of complexity and with complexity come misconceptions. Occasionally analysts join the club and make basic errors as well, which leads to further confusion. In this section we highlight a couple of funds where we noticed a couple of misconceptions this week. These misconceptions are not purely academic but can lead investors astray in their allocation decisions.
Let’s kick off with the Barings Corporate Investors (MCI). Here, some investors make a category mistake by comparing the performance of MCI to that of credit CEFs.
In reality, MCI should be viewed as a BDC, or at least a mix of BDC and CEF. This is primarily because MCI holds private credit (with a smattering of equity – pretty much the allocation footprint of BDCs). About 2% of its assets are in public debt. By contrast, credit CEF allocation is exactly reversed. Credit CEFs hold almost entirely public credit assets with very little or no private debt.
What differentiates MCI from traditional BDCs is its low level of leverage (low even for a CEF) as well as a lack of incentive fees. It seems that the company tends to piggyback on sponsor-led opportunities and don’t do a lot of direct lending themselves which means it can run in a bare-bones low fee way.
MCI, along with its sister fund MPV, is often extolled as “the best” or “one of the best” CEFs in their sector. When commentators use the word “sector” what they mean is the High Yield corporate bond sector because that’s where CEFConnect sticks it. However, this view makes two errors.
One, a quick look at the fund’s actual holdings will show that it holds mostly loan exposure and so should really be compared to loan funds.
And, two, as the discussion here suggests, it shouldn’t really be compared to CEFs holding public debt and should instead be compared to funds that hold private debt (i.e. BDCs). If we compare the fund to BDCs, we see that it has fairly average to slightly above average performance over various periods in total NAV terms. In short, investors who love MCI will be head over heels with any number of BDCs if they had a look at that space.
Moving to the XAI Octagon Floating Rate & Alternative Income Term Trust (XFLT), comments about which also crossed our screen this week.
Specifically, there is a view that XFLT is a great fund because it buys and holds assets at a discount. This is a misguided view for 2 reasons. One, right now the vast majority of credit securities, with the exception of Municipal bonds, trade below par. As a sidenote, and as many investors know, Municipal bonds are typically issued at “round” coupons of 4% or 5%, rather than at their yields due to a historic convention. This keeps their prices elevated vs. par.
Corporate bonds, on the other hand, are issued as “par” assets i.e. with coupons matching their yields at issuance. And because corporate bond yields are currently elevated relative to the coupons at which the bonds were issued, the average corporate bond trades well below par.
Floating-rate assets like loans have prices that are a function of credit spreads rather than overall yields and because credit spreads are not all that wide, loans are actually trading pretty close to par. In May the average bank loan was trading north of $97 and spreads have tightened a bit since then so the average price should be even higher now.
XFLT is a fund that holds CEF Equity and bank loans. Out of all corporate credit assets, bank loans are trading at the least discount to par so it’s certainly odd to highlight XFLT on this basis.
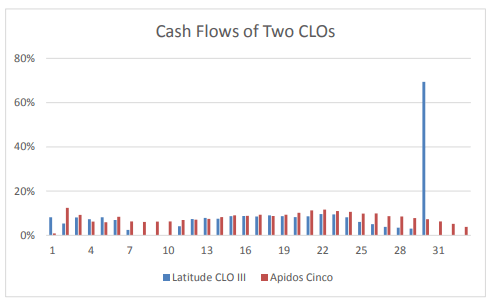
Turning to CLO Equity, it’s certainly true that CLO Equity securities are trading well below 100%. However, unlike bonds and loans, CLO Equity doesn’t mature at par.
As we pointed out some time back in an article focused on CLO Equity misconceptions, CLO Equity cashflows are all over the place. Some CLO Equity securities look like annuities while others have a larger payout in the end, though nowhere near 100%.

Moody’s
This means that anyone buying CLO Equity expecting it to mature at par should get a good primer on the asset class. In short, XFLT is just about the worst fund to highlight from a discount to par perspective because half of its portfolio is trading right on top of par while the other is not going to mature at par.
Market Commentary
We continue to keep an eye on the target term CMBS-focused Invesco High Income 2023 Target Term Fund (IHIT). The fund has a termination date in December of this year and trades at a 6% discount. If it terminates, it would be a great opportunity of generating something like a 20% annualized return for half a year. We are not aware of Invesco term funds terminating or not terminating so we can’t use precedent here as a guide unlike we can for Nuveen funds.
One issue we noticed is that the last fact sheet is from April of this year and shows cash as 1% of the portfolio whereas the shareholder report from earlier shows that about 14% should have matured by April already. This might mean the fund is rotating the cash into new securities which may mean they don’t plan to terminate.
Obviously, CMBS is a sector that’s making everyone a bit nervous these days. However, we need to keep things in perspective. The overall CMBS delinquency rate has moved to 3.6% from 3% over the past year. This is in the context of a 10% delinquency rate during COVID. If we look at the IHIT total NAV return over the past 5 years, it’s around +6% total (not annualized) which captures a big chunk of a market environment that was 3x as bad as now which is not too bad.
Brandywine Global Investment Management estimate that losses on CMBS Office securities could reach mid-to-high single digits, leaving investment-grade tranches largely unscathed. Recall that IHIT holds predominantly investment-grade CMBS tranches and the fund’s allocation to the Office subsector is about a fifth of the portfolio.
An important difference is that going into COVID, CMBS was not priced for a bad outcome whereas now it is. Not only that but short-term rates are obviously elevated relative to history which allows the fund to generate a high level of income on its floating-rate assets.
In short, if IHIT terms out, it could actually perform fairly well, particularly now that its discount has widened out so a failure to terminate is not the worst thing that could happen.
Read the full article here


