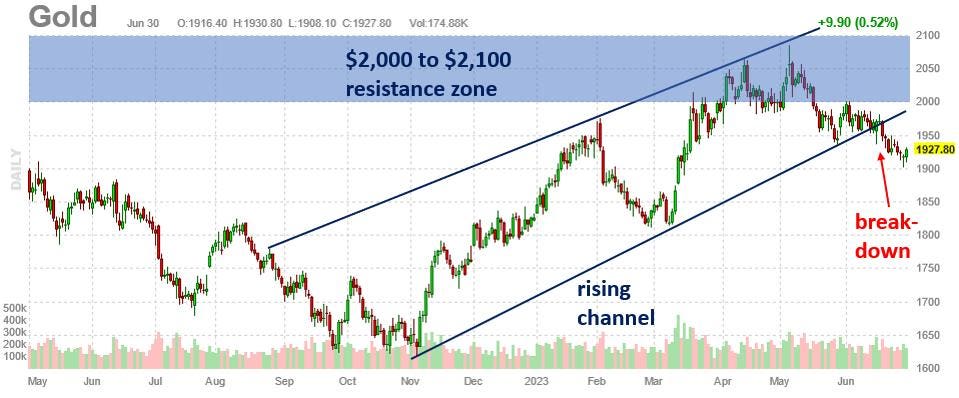
In my last gold market update in April, I showed how gold was sitting just below a very important resistance zone between $2,000 and $2,100. I said that gold needed to clear that resistance zone in a convincing manner to signal that another leg of the uptrend was likely ahead. Alas, gold bumped its head at that resistance and has since fallen by approximately 8%. Gold’s recent decline also resulted in a break-down from a rising channel pattern that formed in late-2022 — a development that increases the chances of further downside in the shorter-term, unless gold can negate its recent breakdown.
The weekly chart makes it easier to see the $2,000 to $2,100 resistance zone along with the rising channel that was recently broken:
The monthly gold chart shows both the $2,000 to $2,100 resistance zone and the long-term uptrend line that formed nearly two decades ago. As long as gold remains above that uptrend line, then it is still in a long-term bull market.
Gold has struggled lately as U.S. banking crisis fears have receded and resilient economic data increase the chances of even more rate hikes this year. Despite gold’s disappointing recent performance, I am still bullish on gold in the long-run because nothing has been fixed in our debt-driven farce of a global economy. It’s only a matter of time before today’s high interest rates cause something to break, leading to another financial crisis and recession, which will lead to lower interest rates, more quantitative easing, another debt binge, and further debasement of fiat currencies such as the U.S. dollar and euro. All of those factors support the long-term investment case for gold.
Please add me on Twitter and LinkedIn to follow my updates and economic commentary.
Read the full article here


