Homebuilders Rankings
This is an abridged version of the full report and rankings published on Hoya Capital Income Builder Marketplace on June 29th.
Hoya Capital
To the surprise of countless pundits and experts, the United States housing industry has quietly started to emerge from its year-long recession, thawing from a deep freeze induced by historically aggressive monetary tightening by the U.S. Federal Reserve. Rebounding from punishing declines of nearly 30% last year that sent valuations of public homebuilders to housing-crisis-era lows, these builders have surged 50% through the first half of 2023 as “crash” concerns proved misguided. While homebuilders are not out of the woods yet given the ongoing uncertainty over the path of Fed policy and mortgage rates – which ultimately dictate short-term changes in housing activity – we believe that the risk-reward for the homebuilding sector remains skewed to the upside. In the Hoya Capital Homebuilder Index, we track the 15 largest homebuilders, which account for roughly $100 billion in market value.
Hoya Capital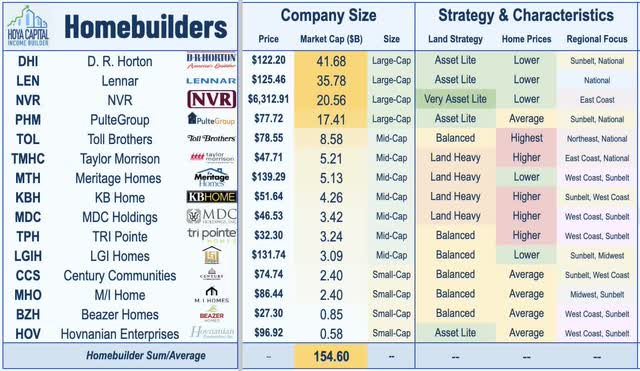
Many of the same pundits that predicted a housing market “COVID-collapse” early in the pandemic – only to see perhaps the biggest one-year “boom” in housing market activity ever seen – again reemerged with the same conviction in late 2022, again predicting a cascading wave of distress and the bursting of the “bubble” in home values. While changes in mortgage rates certainly do have an impact on short-term demand trends – a theme that we’ve seen both on the upside and downside over the past several years- recent data has indicated that the recent regime of higher mortgage rates has merely delayed – but not permanently altered – the existing secular fundamentals supporting the single-family market resulting from the “lost decade” of single-family construction ahead of the wave of Millennial-led demographic-driven demand. New home construction has seen a slow, grinding recovery since plunging during the prior recession – a period in which roughly half of private homebuilders in the U.S. went out of business – and by nearly all measures, the U.S. has simply not built enough single-family homes to meet demand.
Hoya Capital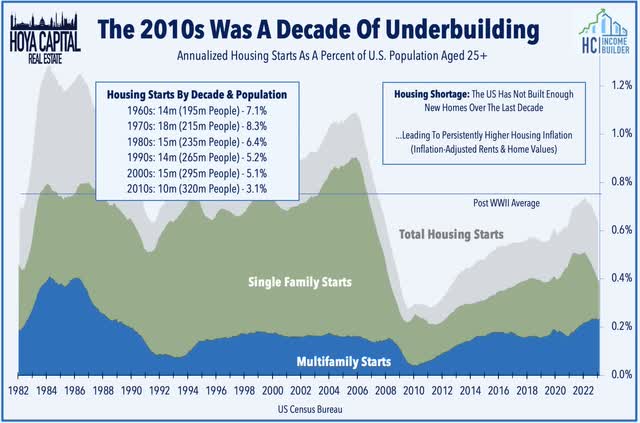
After bottoming in early 2021 at 2.65% and remaining below 3% as recently as November 2021, the 30 Year Fixed Mortgage Rate soared to above 7% in the subsequent twelve months – the most significant surge in mortgage rates in at least four decades and roughly double the “velocity” of previous jumps in mortgage rates. Naturally, with a significant segment of the market suddenly priced out of the market at those rates, housing market activity cooled dramatically during this period with essentially all of the major monthly housing reports showing a considerable contraction. As goes the U.S. housing industry, so goes the U.S. economy. The sharp cooldown in housing market activity in 2022 had substantial ramifications for broader economic growth – and in fact, essentially single-handled pulled the U.S. into a technical recession in early 2022. Reversing its role from early in the pandemic as a key source of offsetting strength amid broader weakness, residential fixed investment was responsible for about 80% of the GDP decline during that period.
Hoya Capital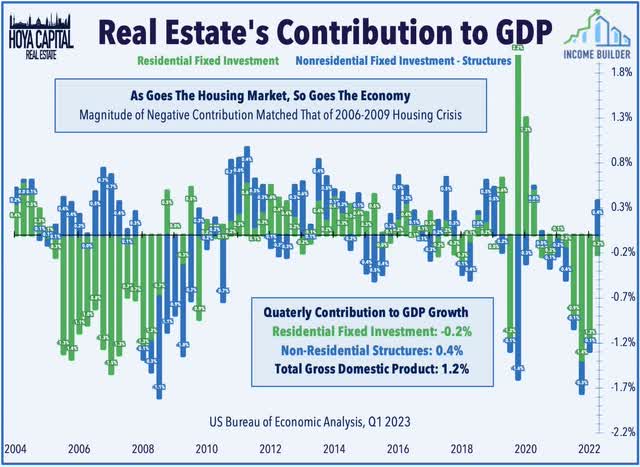
The emergence of the residential housing industry from its year-long recession has been a much-needed stabilizing force for the U.S. economy since early Spring. Left for dead at the start of the year, the rebound for single-family homebuilders has been sparked by this surprising inflection in housing market data, corresponding with a modest retreat in the 30-Year Fixed Mortgage Rate from its peak last October. Data in recent weeks confirmed that the momentum has continued into the Spring months, as New Home Sales surged in May to the strongest level since early 2022, which marked the first year-over-year increase in two years. Housing Starts rose to the highest level since last April, snapping a streak of 11 straight months of year-over-year declines in housing starts beginning in May 2022. Homebuilder Sentiment index – a leading indicator of housing market activity – rose for a sixth-straight month in June, which follows a stretch of thirteen straight monthly declines.
Hoya Capital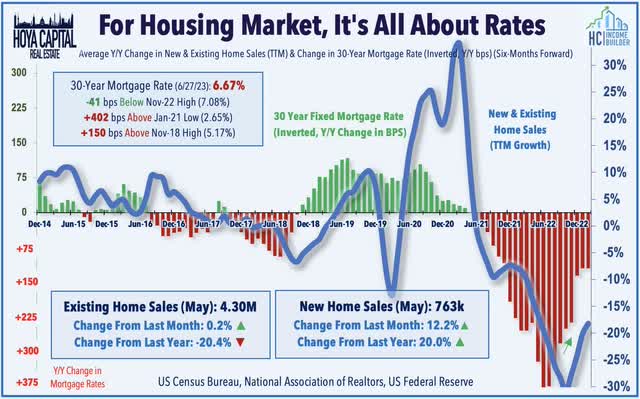
Perhaps most importantly for the long-term health of the housing market, home price appreciation normalized rather dramatically during the housing cooldown. Case Shiller National Home Price Index data this week showed that home values declined 0.2% year-over-year in its latest report, the first negative print in over a decade. The cooldown in home price appreciation is welcome and critically necessary to avoid a speculative bubble that was beginning to build – and the longer-term pain that would result from a period of significantly negative national home price appreciation. This cooldown came just-in-time to avoid these issues, in our view, as home prices aren’t wildly out-of-line with personal income growth over long-term measurement periods – the metric that is most fundamentally correlated with home values. Depending on the measurement period, we find that national home prices are between 10% overvalued and 20% undervalued based on the historical correlation with national personal incomes, the most robust and reliable long-term predictor of home price trends across time periods and regions.
Hoya Capital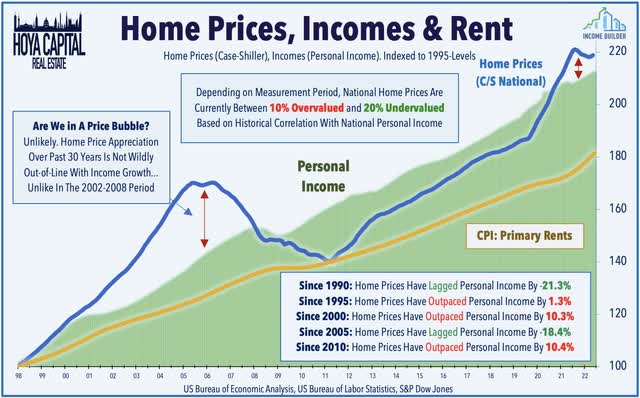
Supply chain constraints further curtailed and prevented a surge in speculative construction activity in the single-family space even when home prices were posting 20% year-over-year increases, and unlike in past cycles, shortages have remained a far bigger concern than excesses. The latest new home sales report showed that newly-completed homes were sold within 2.7 months, on average. Before the COVID-era boom in 2021, this level of inventory would have matched the lowest level on record dating back to 1975. Existing home sales markets remain similarly tight, with just 3.0 months of supply. As with the trends in new home inventory, this supply level would have set a record low before 2020. Properties remained on the market for just 18 days in May while 74% percent of homes sold were on the market for less than a month. Meanwhile, Redfin reported last week that there were fewer homes for sale in May than in any other month on record, citing a mortgage rate lock-in effect noting that “housing supply had already been lacking for years due to a steep dropoff in homebuilding following the 2008 financial crisis.”
Hoya Capital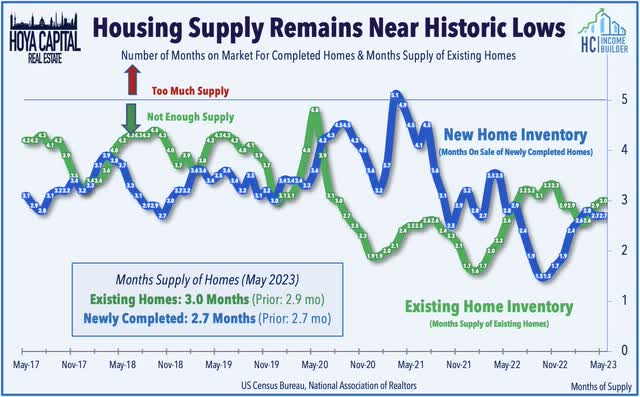
Meanwhile, this underbuilding came ahead a decade in which the largest generation in American history – the millennials – are entering the housing markets in full force, peaking around 2028. Harvard University’s Joint Center for Housing Studies (JCHS) projects that annual household growth through 2028 will average 1.2 million households per year, which is 20% higher than the prior five-year average. As JCHS points out, over the next 10 years, the population in key demographic groups will swell – particularly in the critical 35-45-year-old associated with incremental single-family housing demand. The largest of this cohort – those born between 1989 and 1993 – are just now on the cusp of entering this prime first-time homebuying age. Some more recent developments have also been particularly positive for the housing demand outlook as the U.S. birth rate accelerated in 2021 for the first time in nearly a decade while foreign immigration into the U.S. has accelerated rather dramatically under the Biden Administration at a 141,000-per-month rate since November 2020 according to data from the Bureau of Labor Statistics.
Hoya Capital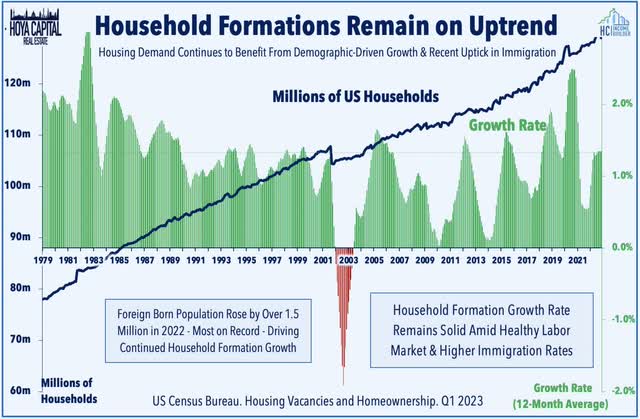
Deeper Dive: Homebuilder Fundamentals
Building single-family homes profitability isn’t easy, and higher rates only made it harder. Exposing a paradox in the central bank approach to tame inflation, the resulting cooldown in housing development likely resulted in a higher longer-term level of housing inflation – which has been driven primarily by a lack of housing supply resulting from this decade of underinvestment. Consistent with our ‘Go Big or Go Home’ thesis, large public homebuilders have gained substantial market share over the past year, explaining some of the sector’s surprising resilience as tighter financing conditions, higher development costs, and ever-increasing regulatory complexity has made it all but impossible for “merchant” builders to profitability construct single-family homes. Together, the 15 largest builders constructed nearly half of all single-family homes in the U.S. last year, up from about a quarter in the mid-2010s and about 10% in the early 2000s, and we expect these publicly-traded builders to continue to expand their market share over the next decade.
Hoya Capital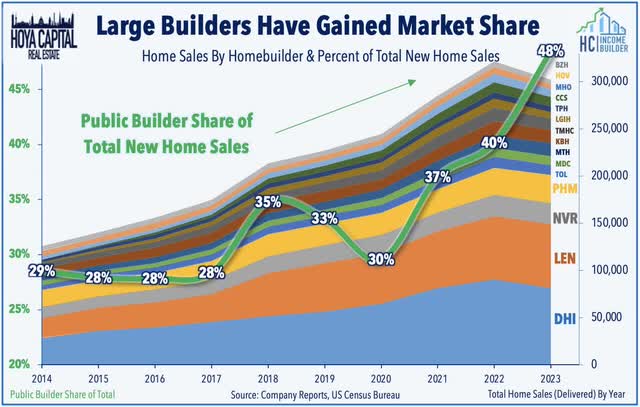
After being slammed at the outset of the pandemic on fears that a coronavirus-induced recession would inflame a repeat of the Great Financial Crisis for the U.S. housing sector, publicly-traded homebuilders delivered historically strong operating performance from late 2020 through early 2022 before the rate-driven housing recession began in the Spring of 2022. All things considered, earnings reports from homebuilders were surprisingly solid in the first quarter of 2023 with these builders exhibiting few signs of the type of distress that would be suggested by their historically discounted valuations. While order growth has declined significantly from the historic levels seen in the prior year, builders continue to work through a substantial backlog of ordered homes that helped to sustain positive revenue growth in early 2023. After surging in late 2022, cancellation rates fell sharply in early 2023 to levels that are roughly back to historic averages in the 15-20% range, down from an average of nearly 30% in Q4 last year.
Hoya Capital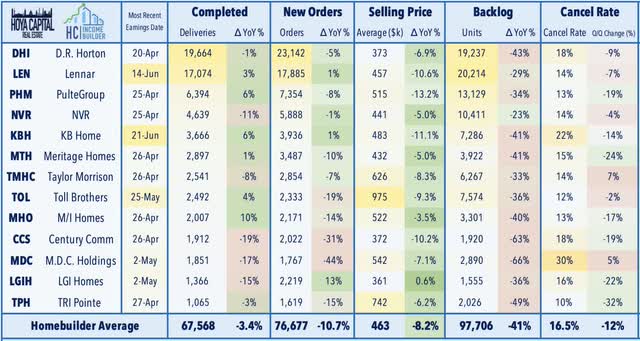
Taking a step back, the US single-family homebuilding sector is a cyclical, competitive, and fragmented industry, while also being one of the slowest sectors to recover from the Great Financial Crisis. Homebuilding can be broken down into two distinct businesses, each with different risk/return characteristics: 1) Land Development; and 2) Home Construction. Historically, homebuilders have been overweight in the land development business, but large public builders have increased their use of land options, offloading the land development responsibilities onto residential lot development companies, allowing these builders to focus on construction and reduce balance sheet risk. Public builders typically skew towards the upper end of the quality spectrum with average prices in the $500k range, above the national averages.
Hoya Capital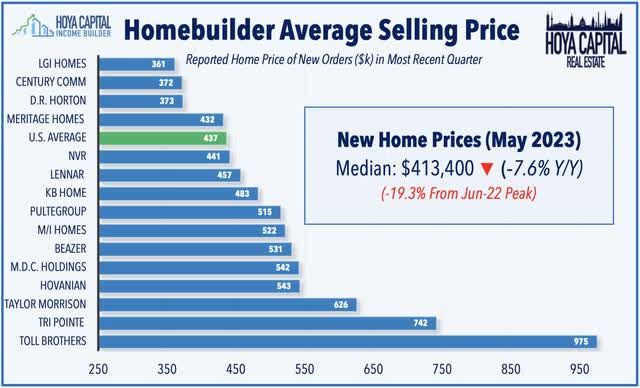
Notably, recent results from Lennar (LEN) and KB Home (KBH) this month each showed positive year-over-year growth in net orders for the first time in a year. Because builders were already operating above maximum build capacity and sitting on historically large backlogs, the pullback in new orders in late 2022 is not as concerning as it would otherwise appear. Builders still report nearly 100,000 units in their backlog – levels that are well above that of the pre-COVID era. Despite the supply chain headwinds and double-digit cost inflation, homebuilder profit margins have also remained above pre-COVID levels. Homebuilder gross margins averaged nearly 28% for full-year 2022 – by far the strongest year on record – but retreated back to 23.0% in Q1. Net margins climbed to 18.8% in full-year 2022 but cooled to 13% in Q1.
Hoya Capital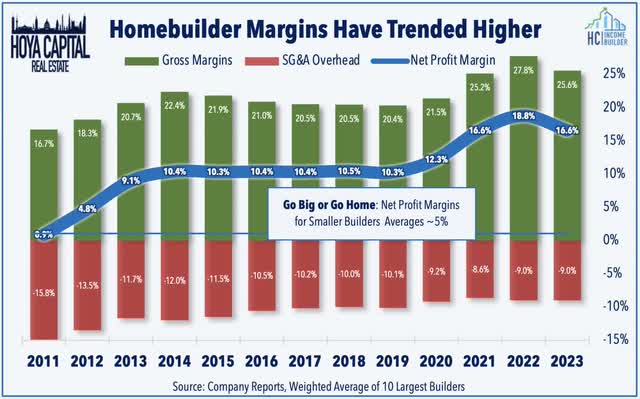
Consistent with the “Go Big or Go Home” thesis, home building is a high-operating-leverage business with relatively low margins, so size and scale are a critical competitive advantage for these large homebuilders. Even within our index, which only includes the largest builders in America, this critical importance of operating with a “minimum scale” becomes abundantly clear. Following the profitability trendline, it becomes apparent why smaller, private homebuilders have become an increasingly rare breed in recent years and why we haven’t seen – and likely won’t see – the uncontrolled building “boom” that wreaked havoc in the prior housing cycle. The smallest builder in the index, New Home Company – which was acquired by Apollo in 2021 – reported operating margins of under 3% in full-year 2020.
Hoya Capital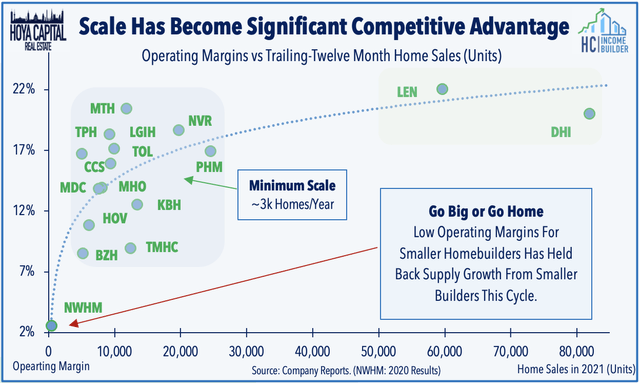
Homebuilder Valuations and Dividends
Rebounding from punishing declines of nearly 30% last year that sent valuations to housing-crisis-era lows, homebuilders have surged by over 50% through the first half of 2023 as “crash” concerns proved misguided. The Homebuilder sub-index within the Hoya Capital Housing Index is higher by 52.0% this year, outpacing the 14.2% increase from the S&P 500 ETF (SPY) and the 0.4% decline from the Vanguard Real Estate ETF (VNQ). Every homebuilder is higher by at least 30% this year, but smaller builders have delivered a particularly strong rebound this year, with three small-caps delivering gains of over 100%: Green Brick (GRBK), Hovanian (HOV), and Beazer (BZH). Many of the larger builders have lagged this year, including D.R. Horton (DHI), NVR (NVR), and Lennar after seeing more muted declines in 2022.
Hoya Capital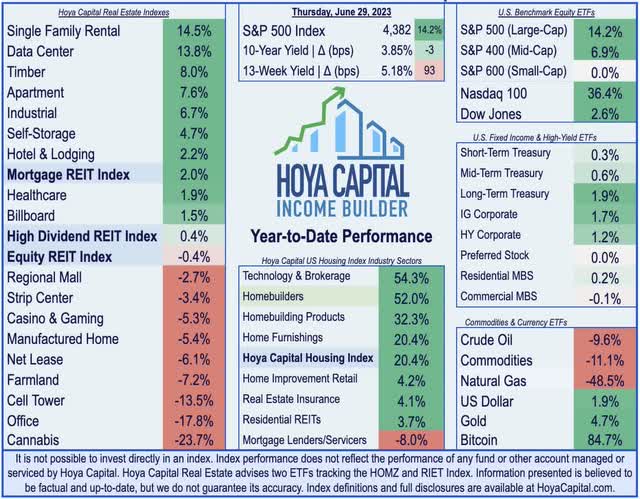
Homebuilders are not typically known for their dividends – instead plowing essentially all retained earnings back into land acquisitions and other channels of growth. That said, eight builders do indeed pay a dividend, led by M.D.C. Holdings (MDC) which pays a roughly 5.27% yield. All seven of these homebuilders have raised their dividends at least once since the start of the pandemic. Notably, the builders that do pay a dividend have achieved dividend growth of over 14% over the past three years, far outpacing the S&P 500 dividend growth rate of roughly 7% during that time.
Hoya Capital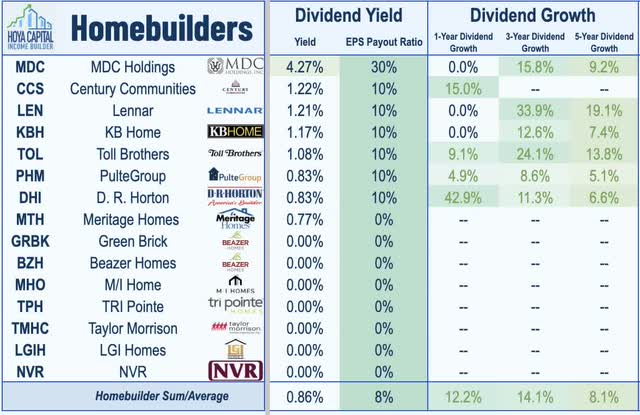
Homebuilders have delivered EPS growth of over 40% per year over the past five years, nearly triple the 15% annual EPS growth by S&P 500 components during that time. Despite this strong historical earnings growth, homebuilders trade at some of the lowest P/E multiples across any equity sector. Within the sector, we note that investors generally award relative premiums to the large-cap builders like D.R. Horton and Lennar, as well as to builders with more “land-lite” options-heavy strategies, including NVR.
Hoya Capital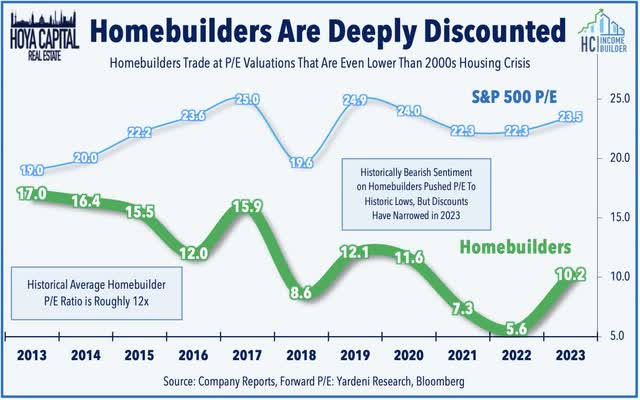
Deeper Dive: Housing the Next Generation
As discussed above, there are roughly 20 million more U.S. households now than there were at the start of 2000 and we believe that the household formation rate will see continued gradual increases over the next five years as the millennial generation enters prime first-time homebuying age. The recent gains in the homeownership rate have been driven by a continued rise in the household formation rate among younger cohorts, which sent vacancy rates of both owned and rented housing units to multi-decade lows. We forecast a continued steady uptick in the homeownership rate over the next decade as millennials enter the housing markets in full force over the next ten years.
Hoya Capital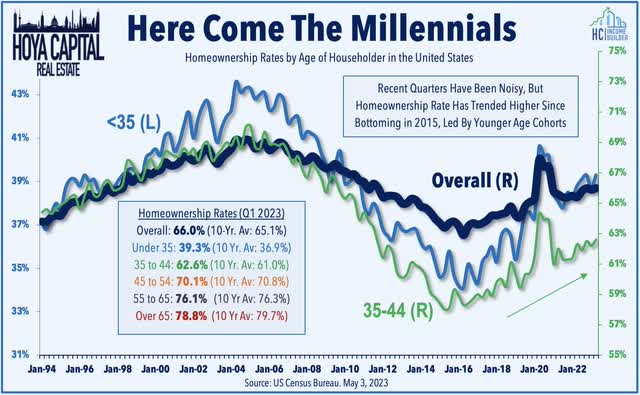
If affordability – or lack thereof – is the primary headwind for homebuilders, there may be good news as the growing presence of institutional single-family rental operators has supported demand for affordable “built-for-rent” homes. As noted above, consistent with our view that the “institutionalization” of the single-family housing sector is a trend in the early innings, we expect built-to-rent buyers to account for a growing percentage of new home sales and single-family housing starts over the next decade, giving these builders a sales avenue even if individual homebuyers continue to have affordability difficulties. We expect built-to-rent buyers including American Homes 4 Rent (AMH), Invitation Homes (INVH), and Tricon Residential (TCN) to increasingly favor new home construction over existing home acquisitions – largely through partnerships with homebuilders – to fuel portfolio growth.
Hoya Capital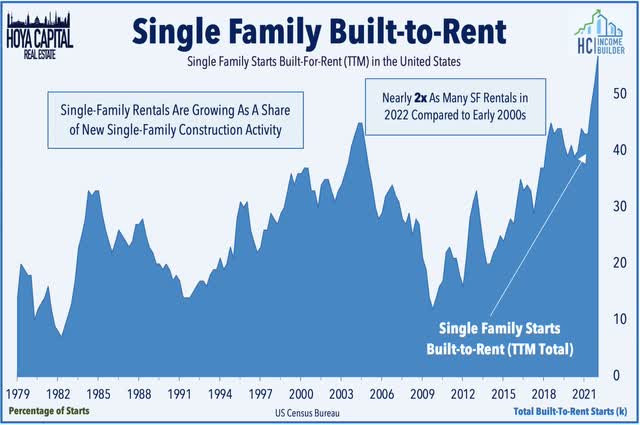
Finally, you can’t discuss the housing sector without mentioning the enormous impact of real estate technology in fueling the future growth of the sector over the next decade. The “prop-tech” industry includes data and technology companies including Zillow (Z), Black Knight (BKI), CoStar (CSGP), and Redfin (RDFN), as well as tech-focused brokerage firms like Realogy (RLGY) and RE/MAX (RMAX), all of which have helped to streamline the buying, selling, and renting process of housing properties. The availability of technologies like virtual house tours and the increased adoption of digital relationships between renters/homebuyers and landlords/brokers have proven to be especially critical amid the pandemic disruptions.
Hoya Capital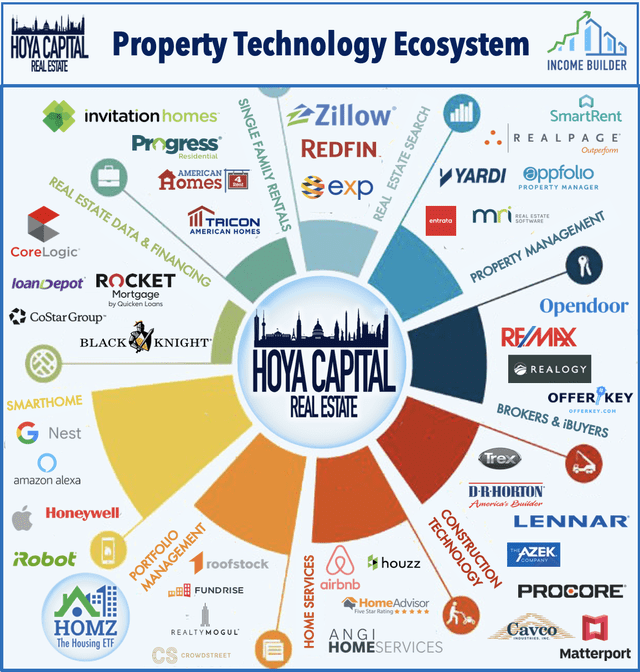
Takeaway: Short-Term Pain, Long-Term Gain
Higher mortgage rates have delayed – but not permanently altered – the existing secular fundamentals supporting the single-family market: a “lost decade” of single-family construction ahead of a wave of demographic-driven demand. The headlines will remain somewhat ugly for another quarter or two as home price appreciation stalls – and even turns negative in some previously red-hot markets – but short-term pain was necessary for an expedited return to “normal” conditions – which were quite compelling before the pandemic-era mini-boom and mini-bust cycle. Building single-family homes profitability isn’t easy, and higher rates only made it harder. Consistent with our ‘Go Big or Go Home’ thesis, large public homebuilders have gained substantial market share over the past year, explaining some of the sector’s surprising resilience. While builders are no longer trading the incredible discounts of last year, long-term fundamentals and valuations for many public builders remain attractive.
Hoya Capital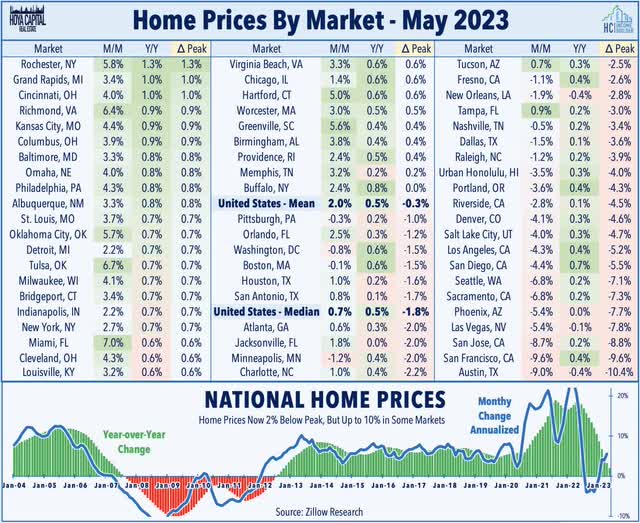
For an in-depth analysis of all real estate sectors, check out all of our quarterly reports: Apartments, Homebuilders, Manufactured Housing, Student Housing, Single-Family Rentals, Cell Towers, Casinos, Industrial, Data Center, Malls, Healthcare, Net Lease, Shopping Centers, Hotels, Billboards, Office, Farmland, Storage, Timber, Mortgage, and Cannabis.
Disclosure: Hoya Capital Real Estate advises two Exchange-Traded Funds listed on the NYSE. In addition to any long positions listed below, Hoya Capital is long all components in the Hoya Capital Housing 100 Index and in the Hoya Capital High Dividend Yield Index. Index definitions and a complete list of holdings are available on our website.
Editor’s Note: This article discusses one or more securities that do not trade on a major U.S. exchange. Please be aware of the risks associated with these stocks.
Read the full article here


