The return of the SPDR S&P 500 ETF Trust (NYSEARCA:SPY) is gradually, but clearly fading. What? How can that be. SPY is up nearly 15% this year. It gained around 7% in the first quarter of 2023 and like clockwork, has essentially matched that return as we close the second quarter of the year. How can the S&P 500 and SPY, the iconic representation of that index in the ETF world, the first-ever ETF, be “fading?”
If investors look at the stock market with their proverbial noses to the ground, the gradual deterioration of SPY’s magic decade-plus run is not readily apparent. However, when you add a few dimensions to the analysis, perhaps what I see will come into focus. And, while I’ve made every investment mistake (twice or more!) in 30 years of professional market-watching and portfolio management, there are “red flags” that hit me like a ton of bricks when they arise. And indeed, they have arisen.
SPY-ing perspective over prediction
By no means am I making some “all-in or all-out” market call here. As I’ve covered in several past articles, investing to me is NEVER black and white. It’s always a shade a grey…and that’s not a reference to a popular book and movie.
I use the SPY as a marker of sorts. The analytical framework I built and evolved since the 1990s is as simple as answering this question: if my only two choices are SPY and a T-bill ETF, how much do I want in SPY right now? Depending on how I am applying that (I have my own money allocated across aggressive/trading accounts, income-oriented accounts, and very long-term-focused accounts), that SPY number may be different. This is in the same way that chartists, of which I am one, look at multiple time frames all the time. Everything from 10-minute charts all the way out to graphs of quarterly prices.
For full disclosure, the latest weekly reading of what I call the ROAR Score (Reward Opportunity And Risk) stands at 35. In other words, for my tactical accounts, I’m targeting 35% of the SPY’s risk. That figure has been in that general range for a few months now. It spent most of 2022 between 0% and 30%.
With that framework summary out of the way, let’s get back to the SPY and what I see that perhaps some investors don’t see, or don’t want to see. After all, making money on rallies is fun. Risk management is boring and annoying. Well, not to me, but I suspect too many “long-term investors.” But that is exactly why the charts that follow will, I hope, serve as an investment lifer’s perspective on what is currently the strangest market I’ve ever seen.
3 dimensions investors best not miss
When it comes to the S&P 500, the “stock market” broadly, and SPY in particular, the two key trends I see are this:
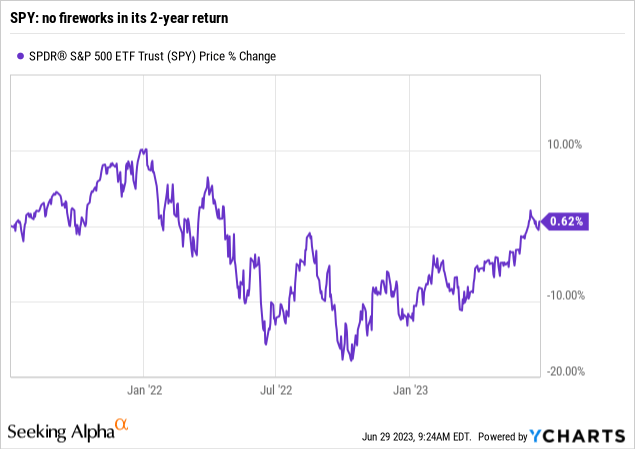
1. 2023 is creating investor excitement, but what is more significant to me is how long SPY continues to not earn much or any net gain when we pull back the lens a bit. For instance, see the chart below. SPY is trading about where it did on July 3, 2021. Otherwise known as two years of nothing. Sure, this excludes dividends, so we can add a few percent to the return and get it positive over that time. But later in July that too will be erased if the market doesn’t continue to rally.

During the 27 years I was a fiduciary investment advisor, facing clients and advising them (before selling my practice and semi-retiring in 2020, which my wife still laughs at since I’m still always working), I constantly felt the need to remind folks about the nature of market cycles. We get so stuck on year-to-date, 3-year, 5-year returns, and other evaluation metrics created by Morningstar and others last century, we don’t look at the nooks and crannies in between. To me, that’s where the real insight is. Bottom-line: few are showing you the 2-year return. But I’ll bet if that was the best face Wall Street could put on their returns, it would be front page news!
2. The second dimension is something that has been all over the headlines, including from many of my fellow Seeking Alpha contributors. It is the extremely narrow nature of SPY’s components. There have been a relatively small number of giant stocks that are getting bigger, dominating the index like we’ve never seen. Heck, just two stocks make up 14% of SPY. Sure, they are great companies, Microsoft (MSFT) and Apple (AAPL), but the US market index has started to resemble many smaller country markets, where the concentration at the top is very, very high.
It is less of a “stock market” and less of a “market of stocks” at the same time, thanks in large part to so much money flooding into S&P 500 Index funds over the past decade. That obscures the fact that 95% or more of the stocks in SPY are just cancelling each other out, some winners, and a few more losers. To me, that’s not a traditional “bull market.” It is a deceptive one, and while it can continue longer than anyone thinks, it is a big risk factor that every investor needs to consider in their own investing. I know I am.
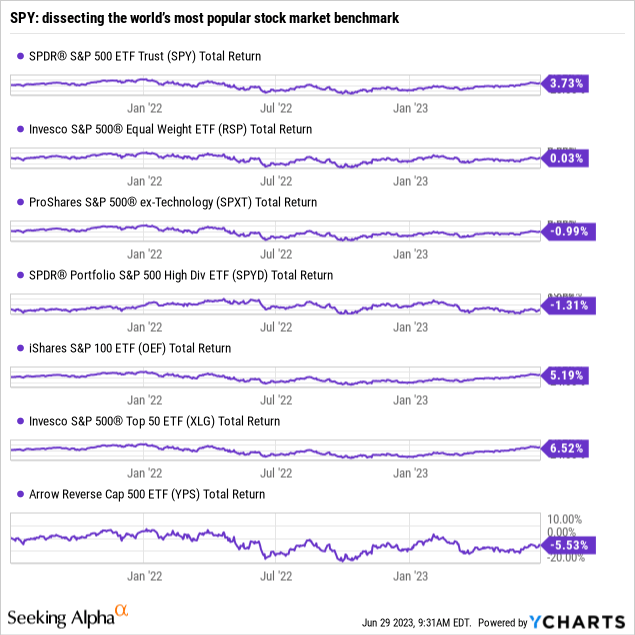
That market condition is also why the chart below looks the way it does. Here, I’ve added the dividends back in to show total return. And, I’ve added some key SPY subsets I track. Bottom-line: over the past 2 years, even with dividends added, SPY is up less than 4% in total, while the average stock is flat. Looking further down the chart, if we simply remove tech stocks, the past two years are down. Same goes for the ETF that screens down to the 80 highest-yielding stocks within the S&P 500.
Dividend investors: take note
One key thing I hope dividend-oriented investors will take from this article is this: we are two years into a period in which many dividend stock strategies are just paying you your own money. The dividends equal the capital loss. Sure it is only two years, but I’ll show below, it is at risk of going on longer.

The lower part of the chart above shows that concentration at the top even more. The 100 largest stocks are up 5.2% over the past two years ahead of the full SPY, and the top 50 stocks are up 6.5%. So, some value-add has occurred by being in those big, mostly Nasdaq-listed stocks. For what it is worth, this is strikingly similar to the years 1999-2000 to me. I managed money through that period and remember it well.
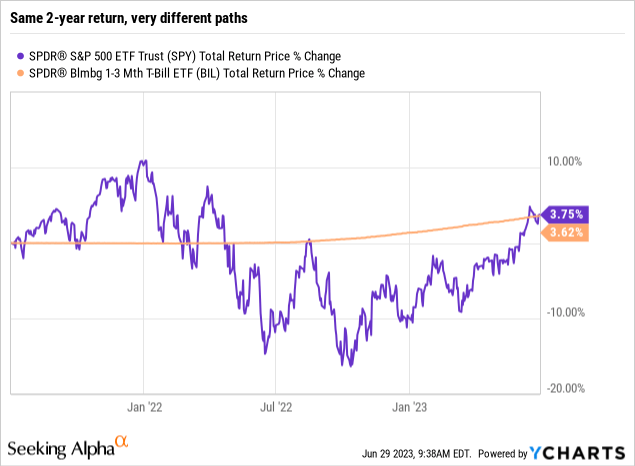
I am not breaking news in saying that short-term Treasury yields have flown higher, and now represent the stiffest competition to SPY in years. Shown below, the shortest-term T-bills are neck and neck with SPY since July 3, 2021. I suspect most investors can live with that for 24 months or so. But the longer it continues, the more likely patience runs out. Especially with two-year Treasuries approaching a 5% yield.


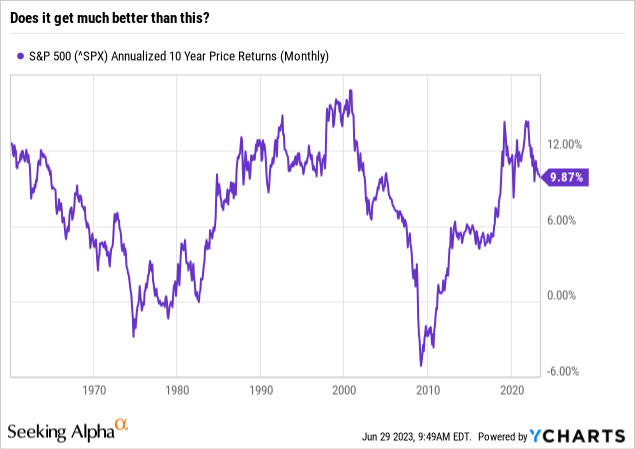
3. OK, now to tie this all together. The third and most significant “dimension” which I think all investors must consider, regardless of time horizon, is shown in the chart immediately above. What it says to me is that long-term returns for SPY have probably peaked for a while. The past 10-year return is right at that proverbial “10% a year” mark that is also a Wall Street myth used to sell product to unsuspecting, hopeful investors.
The top perspective point here: when we go back about 70 years, the most obvious thing to know about investing in the S&P 500 is that its long-term returns are CYCLICAL. Periods of double-digit 10-year runs are followed by periods in which a decade of SPY-style investing gets you somewhere between 5% and -5% a year.
Implications of fading long-term SPY returns
Think about what that does to a “pre-retiree” or retiree. When it comes to long-term investing in the stock market, timing is everything. Not short-term timing, but the ebb and flow of these longer-term cyclical fluctuations.
And, as the far-right section of the chart shows my technician’s eyes is this: the 10-year return for SPY has topped, and it is heading south. At what pace? Heck if I know. Like I said, this is not a market forecast as much as it is a risk-management discussion. Because from what I can see, there is an excessive amount of investor complacency, and that is what can eventually spur emotional investing behavior. And no one should want that.
What I’m doing about this
If there’s anything the last decade has taught us, it is that we can never know when the “buy the dips” era in those mega-cap stocks will end. And maybe it will never end. But that doesn’t mean that elevated risk doesn’t exist. It does. But since, as noted before, I view investing along a continuum, not an in or out process, here’s a summary of how my portfolio is positioned for this gradually evolving erosion I expect in SPY’s returns.
Invesco S&P 500 Top 50 ETF (XLG) is the only ETF of the group graphed above that I currently own “long.” I don’t have any big positions in anything equity-related. Lots of small, tactical stuff that is probably too short-term for most Seeking Alpha’s audience. XLG allows me to have a foot in the door of what has been working all year, but I’m willing to get a piece of that move, rather than try to overindulge in what I believe is a mega-cap-led market trend that is already on borrowed time.
I am “involved” in SPY, but via deep out of the money put and call options. This allows me to “take big shots with small amounts of money” as I like to say. If SPY flies up to new highs, I can turn a molehill into a little mountain. And if it falls through toward last year’s lows, same thing. There are plenty of ETFs that simulate different pieces of this so-called “long combination” strategy. But since this is a strategy, I use whenever volatility is as frighteningly low as it is now (since those options are cheap), I go the extra mile and own the options, calls and puts on SPY, directly.
Maybe there will come a time when I can “call off the dogs” on this long-term concern about SPY’s risk. And when that happens, my ROAR Score will be north of 50, maybe even north of 75 or 80%. But I can’t see that far ahead. Not the way markets work today.
I own a variety of “trial” positions in puts or calls on other ETFs, as well as positions in ETFs outright. I may see a stock from time to time that looks too good to pass up, and some do look interesting. But that’s beyond the scope of this article. I’ll likely come back to that in a separate technical analysis piece.
So, where is most of my portfolio? Treasuries. Directly via bonds out to about 18 months maturity, and a hefty slug of T-bill ETFs. Some of those ETFs target specific spots on the curve, and others which own floating rate Treasuries. As I see it, out to two years maturity gives me the ability to participate in higher rates going forward. And if rates eventually crash (which I don’t see as likely soon), that will probably mean that bearish positions like single-inverse ETFs and will be big potential winners.
SPY: final thoughts for now
SPY has had a great 10-year run, and it can still last a bit longer. But the further out I look, the more risk I see. And I think history is on my side with that view. Because to me, portfolio management IS risk management, above all else. And risk is presenting itself in a long-term way that bears notice, pun intended.
Read the full article here


