With the plethora of financial gurus on CNBC and Bloomberg TV being asked about their opinions on stocks and the economy, I wonder if there’s any value in following these gurus’ advice? One convenient way to follow the gurus is via the Global X Guru Index ETF (NYSEARCA:GURU), which tracks the top holdings of dozens of hedge funds.
Unfortunately, my analysis of the GURU ETF shows it has performed poorly against a passive market index fund because the fundamental strategy is flawed. It tracks lagged top holdings of a select group of hedge funds without realizing that hedge fund strategies may not be designed to maximize absolute returns in the first place. Furthermore, a fund’s largest holding may not be its best performing one.
At the end of the day, I recommend investors use common sense to do their own due diligence on stocks and / or buy passive market funds rather than try to mimic the gurus.
Fund Overview
The Global X Guru Index ETF allows retail investors to invest alongside the leading hedge funds. The GURU ETF follows the Solactive Guru Index (“Index”) which tracks the top equity holdings reported on 13F filings of a select group of hedge funds. The hedge funds selected must have a minimum of $500 million in assets as reported in their 13F filings and the index provider tries to exclude funds with turnover greater than 50% (However, certain funds with greater than 50% turnover may be selected by the committee). Once the pool has been selected, the index provider picks the top equity holding of each fund, and equal weight the positions. The index is rebalanced quarterly following the 13F filing deadlines.
In effect, the GURU ETF is trying to pick the ‘best ideas’ from a diverse group of equity hedge funds.
The GURU ETF has $47 million in assets and charges a 0.75% expense ratio.
Portfolio Holdings
Figure 1 shows the sector allocation of the GURU ETF. The biggest sector weights for the ETF as of May 31, 2023, are Health Care (16.8%), Information Technology (16.1%), Consumer Discretionary (14.1%), and Industrials (11.7%).
Figure 1 – GURU holdings (globalxetfs.com)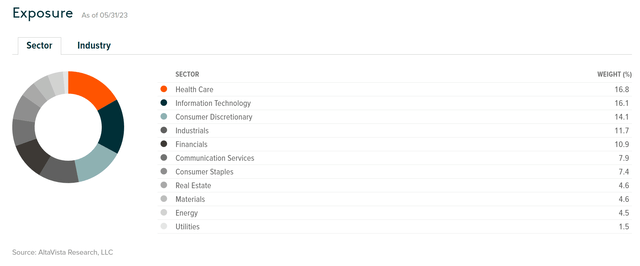
Figure 2 shows the top 10 holdings of the GURU ETF. The top 10 holdings only comprise 19.0% of the portfolio due to the equal weighted nature of the portfolio.
Figure 2 – GURU top 10 holdings (globalxetfs.com)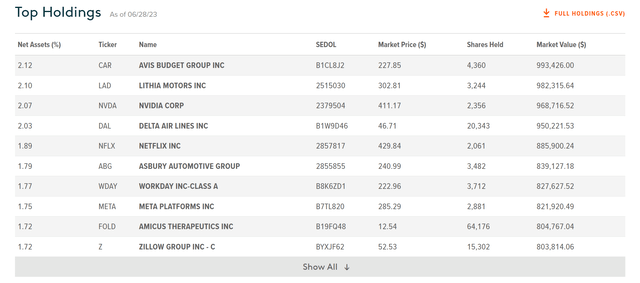
Returns
Figure 3 shows the historical returns of the GURU ETF. The GURU ETF has had some good years (2013, 2017, 2019, 2020), but its average annual performance has been middling, with 3/5/10Yr average annual returns of 1.4%/3.0%/5.8% respectively to May 31, 2023.
Figure 3 – GURU historical returns (morningstar.com)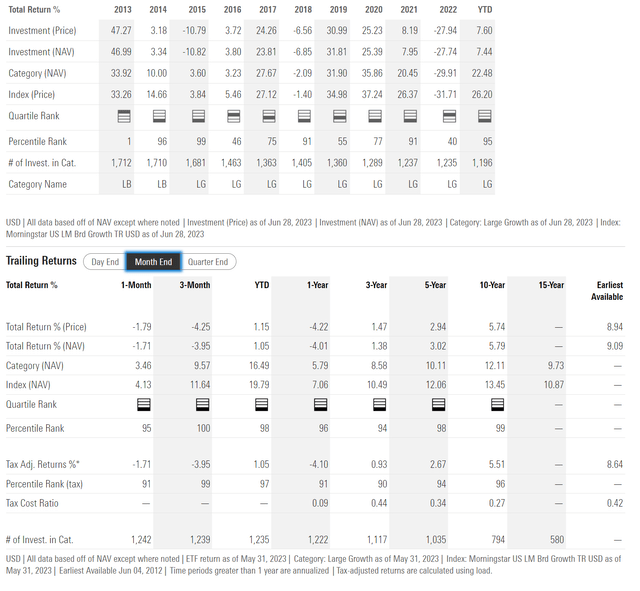
In fact, the GURU ETF has the dubious distinction of ranking in the fourth quartile across YTD/1Yr/3Yr/5Yr/10Yr timeframes against peers represented by the Large Growth category in Morningstar.
Distribution & Yield
The GURU ETF pays a nominal semi-annual distribution with trailing 12 month distribution of $0.07 / share or 0.2%.
Why Follow The Gurus?
I see a number of issues with the GURU ETF’s strategy. First, the GURU ETF tracks 13F filings to see what the top hedge funds hold, but the data is delayed. The 13F filing is a quarterly report that must be filed by any institutional asset manager with more than $100 million in assets. 13F filings are required to be filed within 45 days of the end of a calendar quarter, so for example, the positions held as of the end of December are publicly disclosed by February 14th (if it is not a weekend or holiday).
However, a lot could have changed between the end of the calendar quarter and the filing date. Stock prices may have changed, the macroeconomic environment could be different, and the hedge fund could even have sold their positions by the time the 13F filings are made public.
Secondly, the GURU ETF focuses only on the largest holding of each hedge fund. By narrowly focusing on the top holding of each hedge fund, the GURU ETF may miss the forest for the trees. Yes, having a concentrated ‘high conviction’ portfolio is important, but as a former fund manager, I have found that oftentimes it is my number 4 or number 7 holding that drives the bulk of the performance of my funds, not my largest holding.
Third, 13F filings only show the long holdings of hedge funds. Often, hedge funds may be holding a short against their longs, to hedge away risks they do not want to bear. By focusing on just the 13F reported holdings, the GURU ETF misses half of what hedge funds do operationally.
Finally, there is a misconception that hedge funds must outperform the markets. The fact of the matter is, many hedge funds have different mandates where the goal may be risk-adjusted returns and not absolute returns. For example, the Eurekahedge Long Short Equities Hedge Fund Index has produced annualized returns of 8.2% since the index was created in 2000 (Figure 4).
Figure 4 – Eurekahedge L/S Equities Hedge Fund Index (Eurekahedge)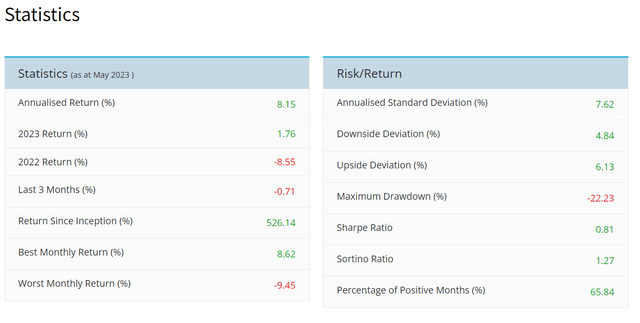
This has lagged the passive SPDR S&P 500 Trust ETF’s (SPY) long-term returns of 9-11% (Figure 5).
Figure 5 – SPY historical returns (morningstar.com)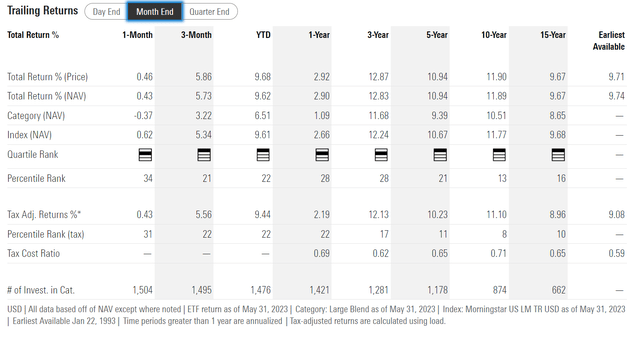
However, what hedge funds excel at may be compressing returns volatility and risk-adjusted returns, as shown by their lower standard deviation of returns and higher Sharpe ratios (Figure 6).
Figure 6 – Hedge funds may have lower volatility and higher Sharpe Ratios than markets (morningstar.com)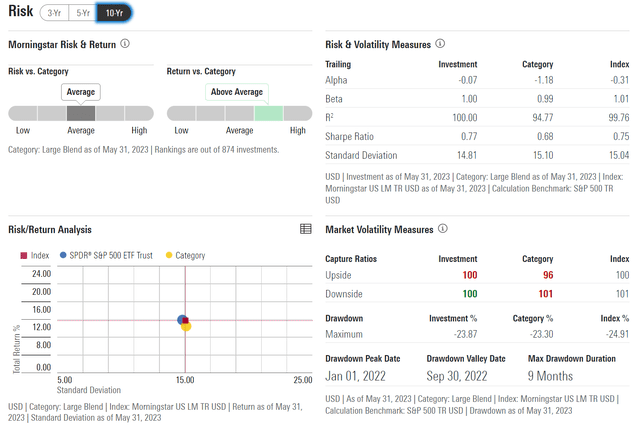
Conclusion
The Global X Guru Index ETF allows retail traders to buy the same ‘high conviction’ stocks of the largest hedge funds. While in theory, the idea of using 13F filings to mimic what the top hedge fund managers buy is ‘sexy’, the reality is returns have been mediocre for the GURU ETF.
GURU’s strategy may underperform because 1) 13F filings are lagging, 2) it narrowly focuses on hedge funds’ top holdings and 3) it makes the leap of faith that hedge fund managers outperform on absolute returns.
I think retail traders are better off doing their own due diligence on specific stocks and/or buying passive market funds like the SPY rather than buying the GURU ETF.
Read the full article here


