Thesis
Bitcoin (BTC-USD) remains in a bear market in my opinion. Patience is a virtue – we must wait for apathy to become the narrative before a true market bottom is reached. For now, I see a host of negatives including weak seasonality, continued regulatory enforcement actions, competition from governmental CBDCs, rising Bitcoin Dominance, distribution by larger holders, greedy sentiment, negative Technicals (i.e, chart), tightening Fed liquidity, lackluster fund flows and negative On-Chain Metrics. While Bitcoin is in a danger zone, the long-term case for Bitcoin remains stronger than ever! The U.S. (and other governments) continues to print more dollars and debase the currency and Bitcoin addresses (i.e, adoption) continues to rise. Further, the approaching Halving Cycle and related strong Tokenomics favor higher prices.
Introduction
I first heard of Bitcoin back in 2017 when my younger colleagues became obsessed with its price (but nothing else). I was working at a bank at the time, so I didn’t have much time to devote to this “rabbit hole.” I took an intellectual short-cut figuring, after little thought, that Bitcoin was a digital coin with little intrinsic value. Six years deep into that rabbit hole, I can see that it’s more than that, though I respect some of the brightest minds such as Nasim Nicholas Taleb that can’t get past Bitcoin’s “culty-ness.”
Where are we now?
Bitcoin and the crypto market overall rebounded wildly from the bottom post the FTX (FTT-USD) fraud in November 2022. At that time, Bitcoin plunged from over $21k to approximately $15.5k. While I believe it’s too early for Bitcoin to become uncorrelated to equities, it showed remarkable resilience during the Silvergate/Silicon Valley bank runs, and continued to rise to the present-day low $30s.
Was November 2022 the Bear Market Bottom?
I was very torn during Bitcoin’s November bottom. I follow a multitude of indicators and nearly ALL of them were saying this was it – “We are at rock bottom.” However, I told my Youtube channel subscribers that this may NOT be the bottom because I was still expecting the Federal Reserve to remain hawkish. Remember, for the time being Bitcoin is Macro and Macro is Bitcoin, meaning that it’s very sensitive to liquidity.
Short-term Indicators are Bearish
I’m certified as a Financial Risk Manager and believe managing risk is a vital success factor if one wants to live through bear markets. As such, I would rather err on the side of caution. I still think Bitcoin could fall, even if it would be like a dancer that’s crouching down before a large jump, as famed trader and dancer Nicolas Darvas once said. Below is a list of red flags for Bitcoin:
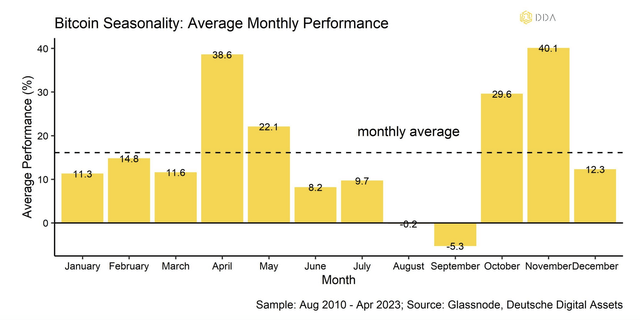
Sell in May and Go Away
As the saying goes, risk assets tend to decline during the summer months, so why take undo risk?
Deutsche Digital Assets
Regulatory Enforcement
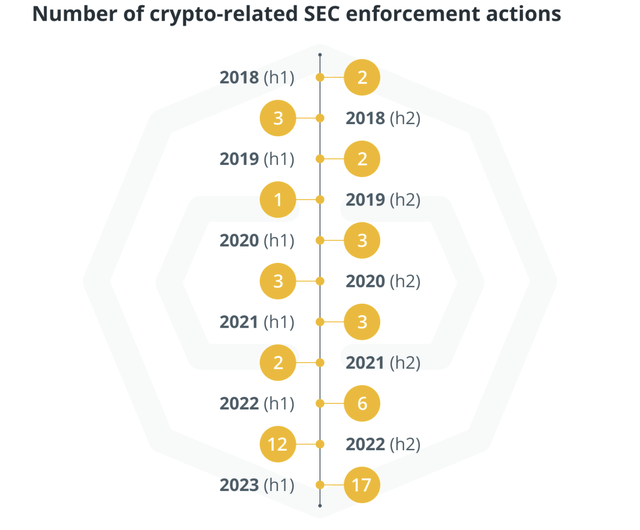
Regulators, particularly Gary Gensler’s SEC, have regulated via enforcement. The SEC has sued crypto related firms over 17 times this year, under what’s called Operation Chokepoint 2.0, (which has been described as a well-coordinated effort to marginalize the blockchain industry and cut-off connections to the banking industry). Operation Chokepoint 2.0 became popularized following a post from venture capitalist Nic Carter. Bitcoin is seen as a threat to the U.S. government’s control of money (and sanctioning power) and a threat to the US Dollar’s reserve currency status. As most readers know, the SEC has recently sued Coinbase (COIN) and Binance (BNB-USD) and has said that all crypto assets are securities. The only exceptions may be Bitcoin and stablecoins. However, on February 2023, the SEC informed Paxos Trust that it was intending to sue them as it considered the Binance USD stablecoin an “unregistered security.” (see the next bullet for additional info on stablecoins). These lawsuits reduce money flows into all digital assets including Bitcoin. While some flows are going into Bitcoin as a “safe haven” this is not sustainable.
CoinTelegraph
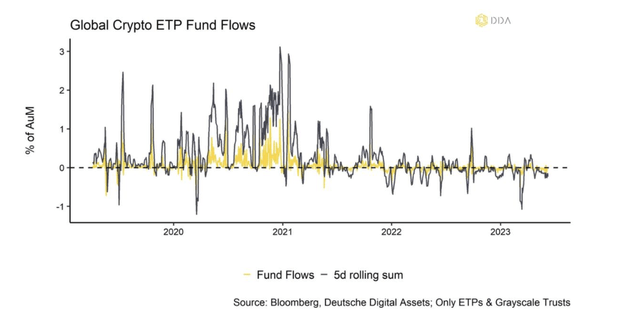
Negative Fund Flows
Speaking of flows, the constant regulatory restrictions and lack of crypto regulation (“rules of the road”) from Congress, has resulted in lower flows going into all digital assets. Note that fund flows tend to vary widely on a week-to-week basis, so it’s better to examine them during a multi-month period (Coinshares provides excellent weekly flow data for those that would like to follow this). I don’t expect institutional flows until at least 2025 when/if there’s regulatory clarity. Lower flows reduce trading liquidity, and as the saying goes, “escalator up – elevator down.”
Deutsche Digital Assets
Stablecoins & Central Bank Digital Currencies ((CBDCs))
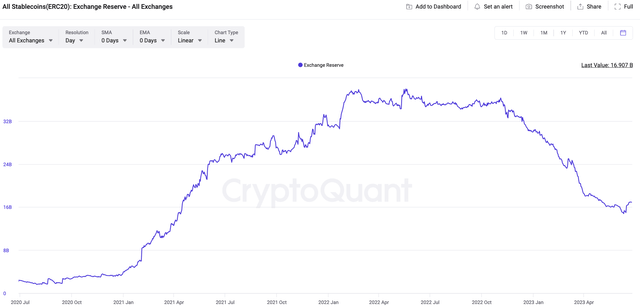
There are also some headline and regulatory risks relating to upcoming regulations on stablecoins. I recently spoke to Senator Kirsten Gillibrand (Democrat-NY) who expects her upcoming digital asset bill to specifically highlight stablecoins. Stablecoins have been described as the “backbone” that allows Defi and non-custodial (i.e., DEX) trading, according to Coin Bureau. Without them, Bitcoin’s liquidity would dry up. Further, stablecoins and Bitcoin are a threat to the US dollar, hence central banks are expecting to introduce their own versions (i.e., CBDCs). The above is both a short-term and long-term risk.
CryptoQuant
Bitcoin Dominance is rising
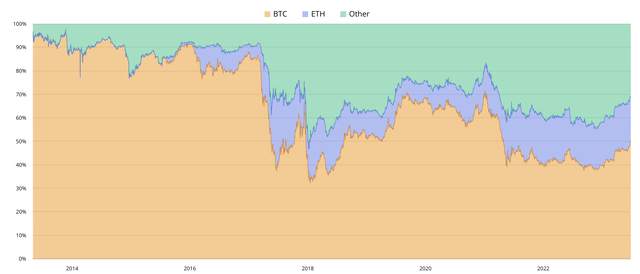
Bitcoin’s market cap, or Bitcoin + Ethereum (ETH-USD), as a percentage of total digital asset market cap, typically grows during bear markets. Note that some blockchain analysts are now grouping Ether with Bitcoin as it’s considered a safe-haven given that the SEC’s Hinman and the CFTC stated it’s not a security. Historically, Altcoins bleed against Bitcoin in bear markets – we’re witnessing this now. In just the last three-months, Bitcoin + Eth dominance rose from 65% to 69%.
BTC Tools
Large Holders of Bitcoin have stopped accumulating
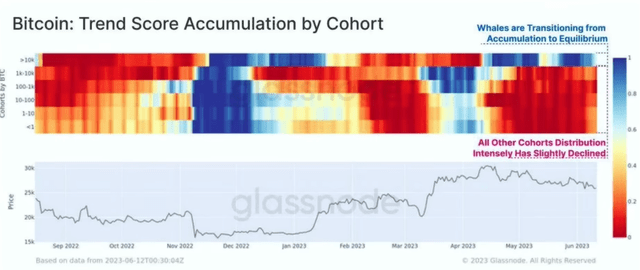
There are different cohorts of Bitcoin holders depending on how large their bags are. The largest, of course, are known as whales. Glassnode tranches them according to six cohorts. During the April-May rally, only the smallest of holders accumulated, the rest (sharks, dolphins, whales…) have been selling aggressively. Typically, small (i.e., retail “weak hands”) investors buy at the top and sell at the bottom. The red squares represent selling, which is occurring amongst most cohorts now, with the exception of the largest holders (> 10k bitcoin) which are neutral. The best time to DCA into Bitcoin is when the squares are blue (accumulation) as occurred post-FTX.
Glassnode
Tightening Liquidity via the Fed TGA
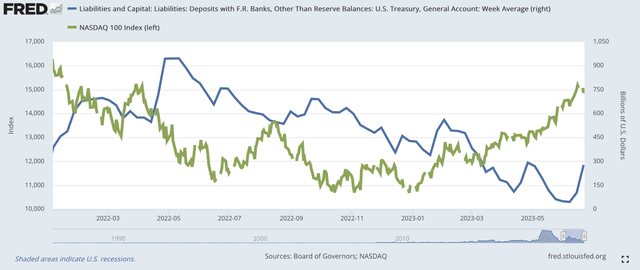
I believe that liquidity has been the primary factor affecting ALL risk assets since 2008. It’s no wonder that Bitcoin and NASDAQ’s artificial intelligence tech stocks have risen recently, as liquidity rose when the Federal Reserve tried to avert the March 2023 bank runs. However, now that the Fed’s slapped a bandage on the Regional Banking Crises and Congress has averted a debt ceiling, the Fed needs to refill its Treasury General Account (TGA). This refilling could drain nearly $0.7 trillion in liquidity. Consequently, I think Bitcoin and Tech are at risk. The rising blue line in the chart below represents the “refilling of the TGA wallet”. The more it rises, the tighter is liquidity. The green line represents the NASDAQ 100 Index (Left hand side axis).
St. Louis Fed
I believe what we’re seeing in both equities and crytpocurrencies is a LIMITED supply of money chasing a few assets – in this case tech stocks and Bitcoin. While Bitcoin has reached a new yearly high, the total Altcoin market has not. Again, this rally is dubious.
Declining Fed Balance Sheet
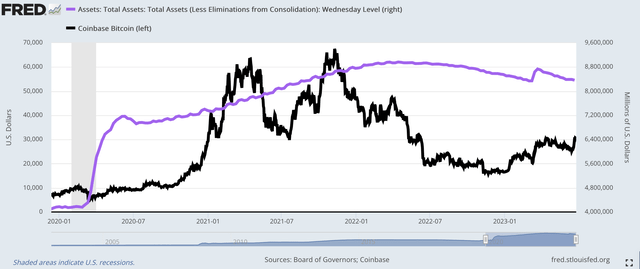
The Federal Reserve’s resumed its program of Quantitative Tightening. This is already being reflected in the chart below where you can see the decline in Total Assets (i.e., Balance Sheet) as shown in the purple line (Right hand axis). One can see how vigorously (albeit delayed) that Bitcoin prices (black line) reacted to the initial rising balance sheet and then declined as the Fed rolled-off its portfolio.
St. Louis Fed
Sentiment has gotten too frothy
I use sentiment as a contrary indicator both for equities and Bitcoin. The excitement over Blackrock’s (Wisdomtree, Fidelity..) ETF application has started to make people giddy. The BTC Tools Fear & Greed Index has turned Greedy. This is often the best time to sell, not buy.

BTC Tools
Derivative Positioning (Options + Futures)
There are several ways to determine sentiment based on the Futures and Options markets. I interpret these from a contrarian point of view. So if everyone is buying relatively more Calls and fewer Puts, that would be a negative reading. While the current Futures market seems negative to neutral, the options market is telling a different story. Traders have been buying call options on Bitcoin (and NASDAQ tech stocks) fairly aggressively. The chart below shows open interest for Bitcoin and Ethereum. Bitcoin’s Put/Call ratio is trading near its lower-end of the three-year range.
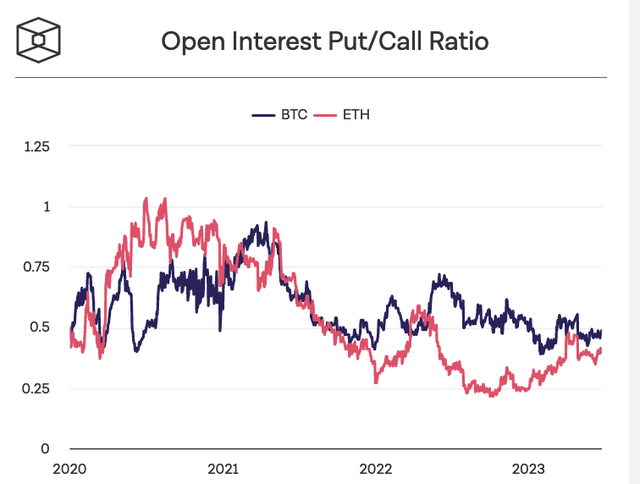
The Block
On-Chain Metrics
I keep track of a dozen metrics and most of them became very bullish at Bitcoin’s Nov/Dec 2022 bottom. However, all of them have moved from Bullish to Neutral at best. The Puell Multiple (which is the daily value of Bitcoin Miner coin issuance divided by its Yearly Average) for example, moved from just 0.36x on December 2022 to over 1.2x during the last three months. For perspective, Bitcoin was trading below $18k when the Puell was 0.36x and around $55k the last time the Puell traded at today’s level. Scary no ?!
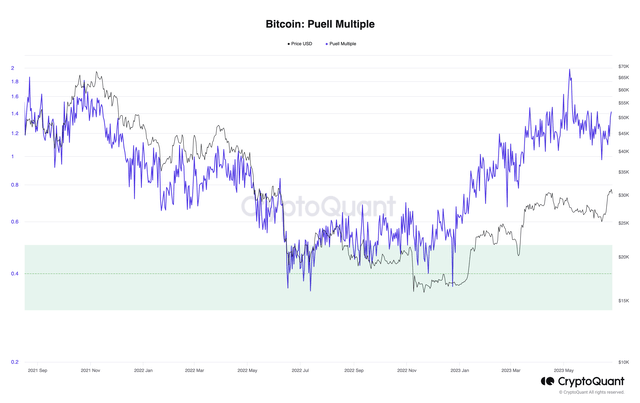
CryptoQuant
Weak Bitcoin Technicals
The way Bitcoin has traded over the last year leaves it vulnerable to high selling pressure above $30k given that there’s huge resistance in this area (See chart). It is also trading against its upper Bollinger Band.
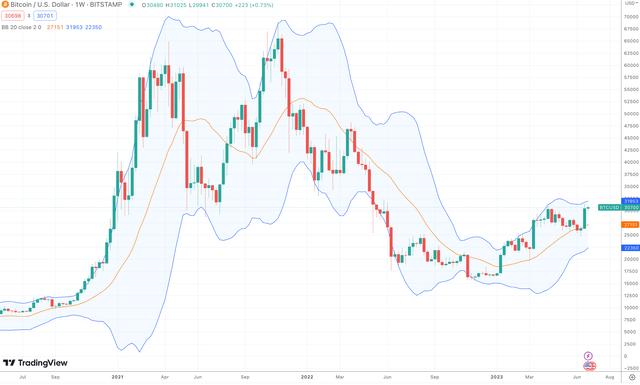
TradingView
So why am I so Bullish long term?
I will delve into details of my long-term bullishness, one Satoshi at a time, in an upcoming SA article. In summary, these positives include Bitcoin’s resistance to the debasement of the US dollar, attempts by the BRICS countries to destabilize the USD as reserve currency (chart below) and positive on-chain-metrics such as rising addresses (aka the “Network Effect”). There is even more than a remote chance that the U.S. could support Bitcoin. Recently, the International Monetary Fund (which is controlled by the U.S.) capitulated on Bitcoin bans saying, “banning may not be effective in the long run.” So there is hope !
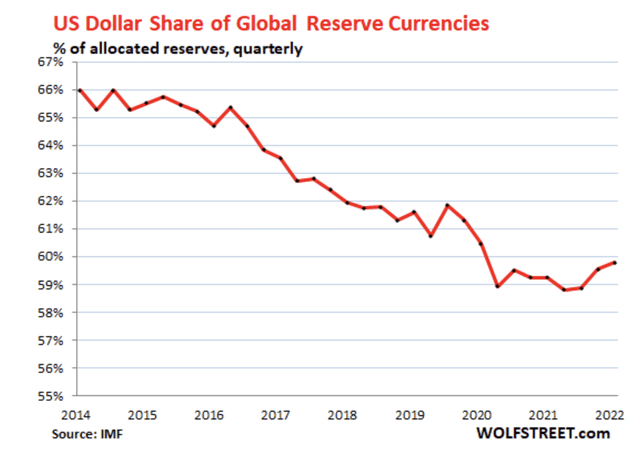
WolfStreet, IMF
Lastly, I will discuss Bitcoin’s excellent Tokenomics, which is characterized by a limited supply (21 million Bitcoin), high circulating supply (19.4 million), the upcoming halving cycle (chart below) large amount of inactive supply and lost coins.
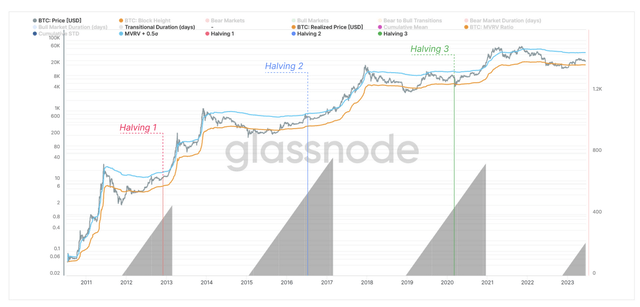
GlassNode
I’ve noticed the media is giving very little airtime to lost coins. These could be Bitcoin wallets that are lost, coins sent to wrong addresses, hard-drive failures, wallet failures, lost seed phrases, or people dying without plans. James Mullarney has estimated lost coins to be between 3-6 million Bitcoin and he says that it could amount to 4% yearly. If such is the case, Bitcoin has ALREADY become deflationary. Below are the returns of Bitcoin one year after each halving (aka Epoch). The last halving was in May 2020 and the next is expected around April/May 2024. Note that the next halving will likely occur in a period of falling supply.
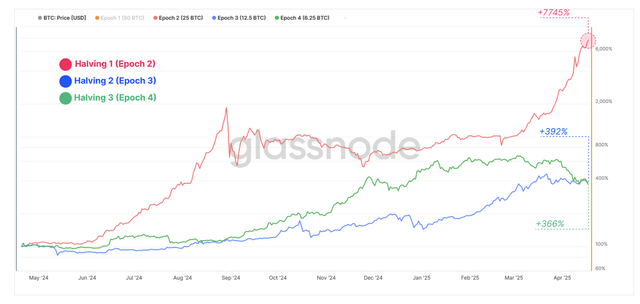
GlassNode
Conclusion
As you can see from the multitude of indicators and fundamentals, Bitcoin seems to be trading at a short-term top. Readers may find it surprising that I’m bullish on Bitcoin given the (perhaps) convincing case I’ve made. Bitcoin’s long-term case remains stronger than ever. Like Nicolas Darvas once said, I think the short-term decline will be more like a dancer’s crouching down before she rises for a big jump. I hope you enjoyed this read and I welcome any questions.
Read the full article here


