Investment Thesis
Company Overview
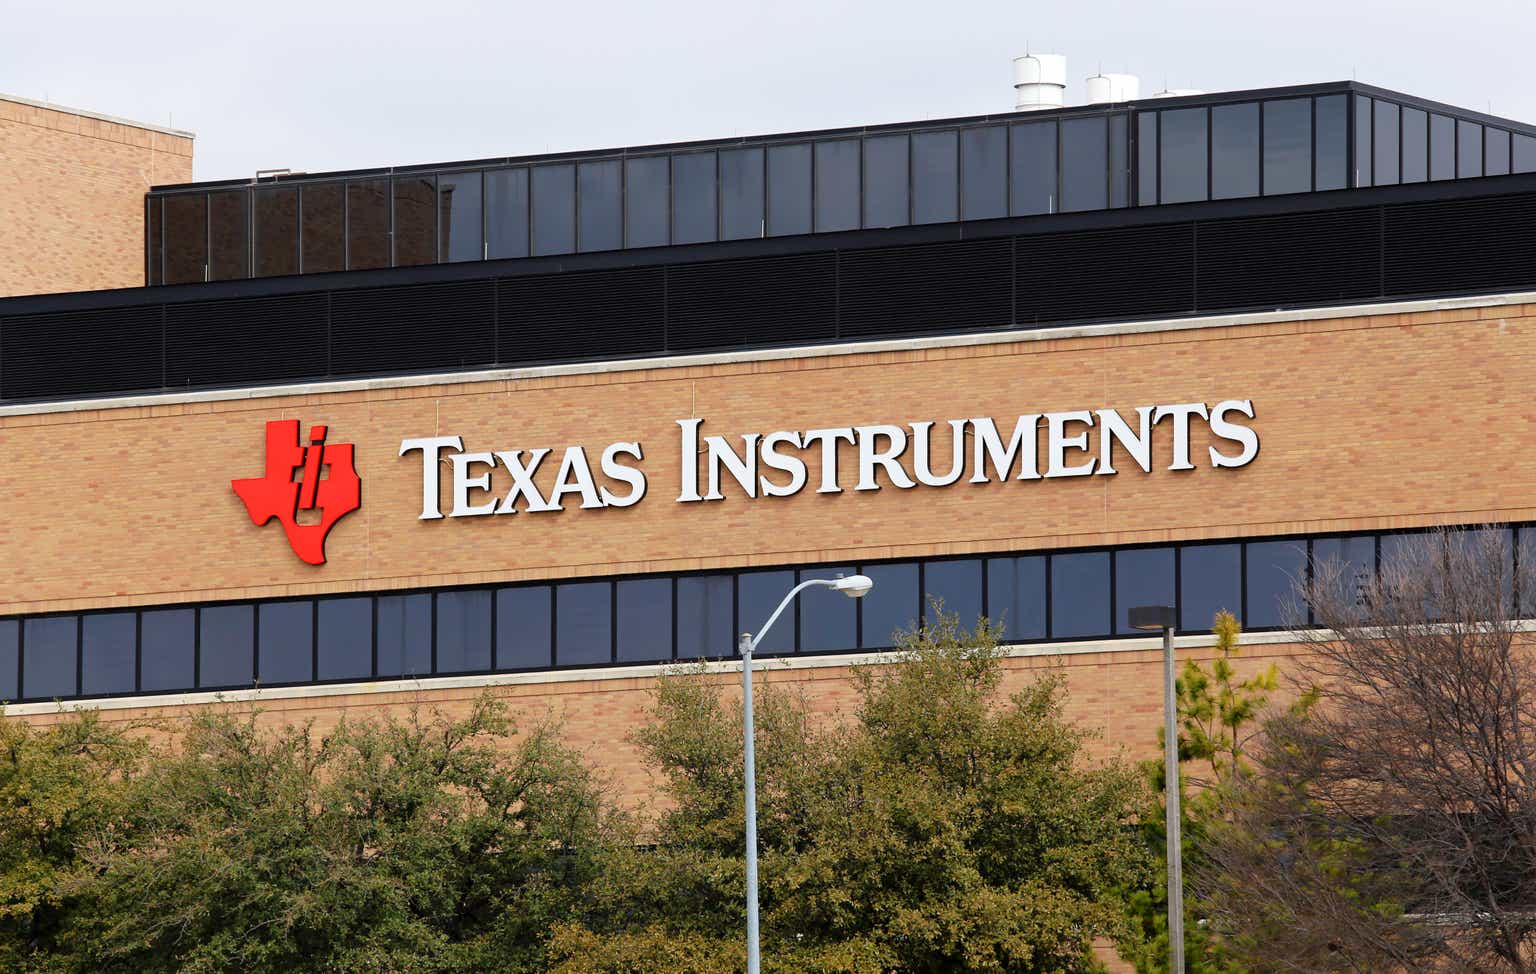
Texas Instruments Inc. (NASDAQ:TXN) is one of the largest semiconductor producers that serves electronic designers and manufacturers globally, founded in 1930 with headquarters in Dallas, Texas. It has two reportable segments: Analog and Embedded Processing, with the rest of the business activities in Other.
Strength
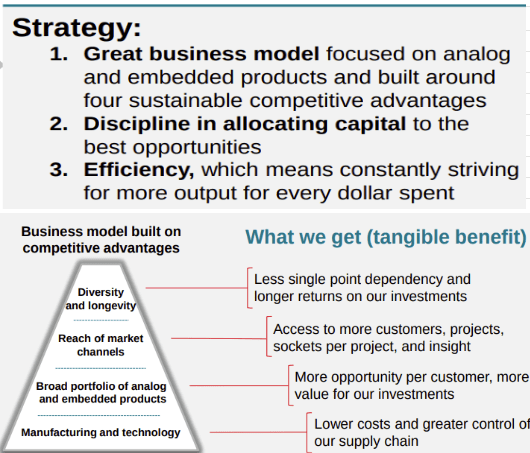
Texas Instruments prides itself on a long term growth commitment to free cash flow per share, as investors can see at the beginning of its presentation. The company has grown its free cash flow per share annually at 11% from 2004 to 2022. The company succinctly outlines the bedrock of its growth on three elements and four advantages in reaching this long-term objective.
txn (txn)
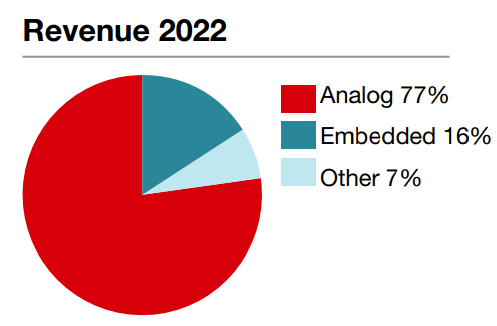
For Texas Instruments’ segments, analog products enable precise measurement, efficient power management, and reliable signal processing, while its embedded processors’ power advanced applications such as robotics, automotive systems, and industrial automation.
txn (txn)
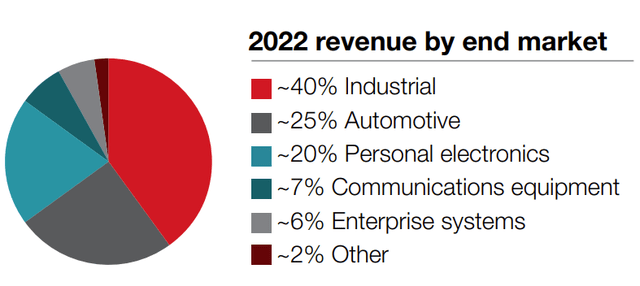
Texas Instruments has six end markets grouped by the type of customers for their products. The largest by revenue is Industrial, with Automotive and Personal Electronics coming close to each other at 20-25%, while Communication equipment and Enterprise systems are in the mid-teens. The company stated in its 10k that it emphasizes Industrial and Automotive segments, which represent long-term growth potential to it.
txn (txn)
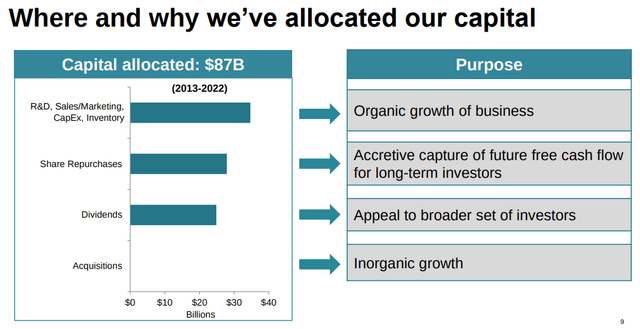
For the past ten years, Texas Instruments have boasted a disciplined approach to allocating capital. It placed the main focus on organic growth and shareholder return, with minimal acquisitions.
txn (txn)
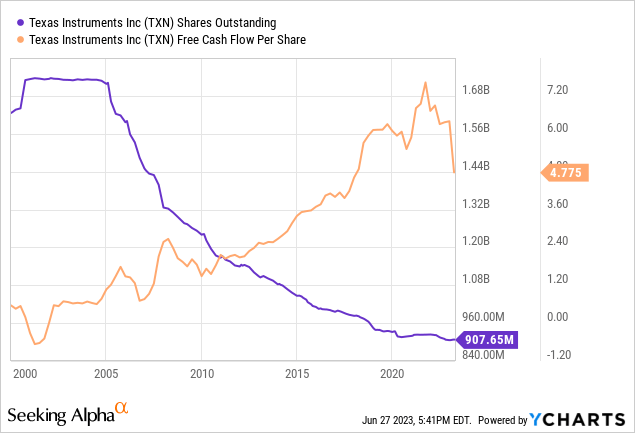
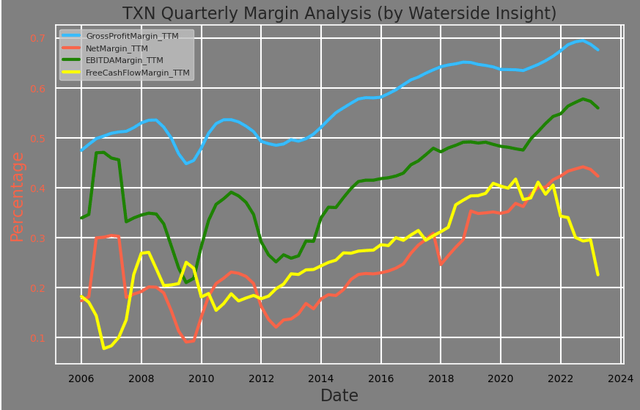
The results from this approach show strong effectiveness. Its gross profit margin has grown from about 50% in 2013 to the current 68%, while its EBITDA margin has grown from 26% to more than double of about 56%. As highlighted by the company, it has had 11% free cash flow per share annual growth, and a 47% share count reduction since 2004. These are all very impressive results.
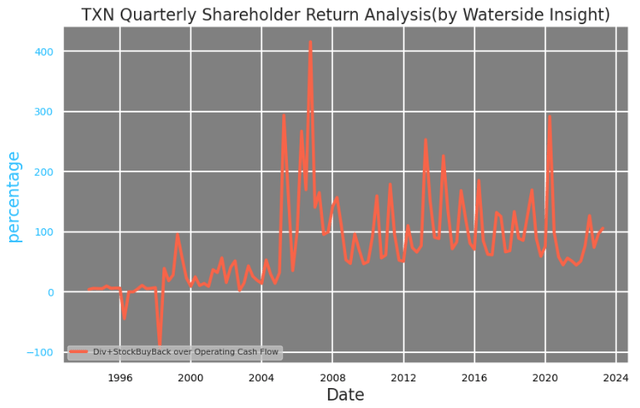
Texas Instruments has been able to achieve all of this while maintaining a solid record of shareholder return. The company has achieved 19 consecutive years of dividend increases. Its spending on dividends and stock buybacks as a percentage of operating cash flow has constantly been, on average, oscillating between 100% to 200% for over a decade, with several occasions exceeding 3x or even higher. Given its capital allocation framework, this is not surprising. We can see previously that the cumulative dollars returned to shareholders were about $55 billion out of $87 total capital allocation in ten years, more than its allocation to R&D, Sales/Marketing, CapEx, and Inventory combined.
txn (txn)
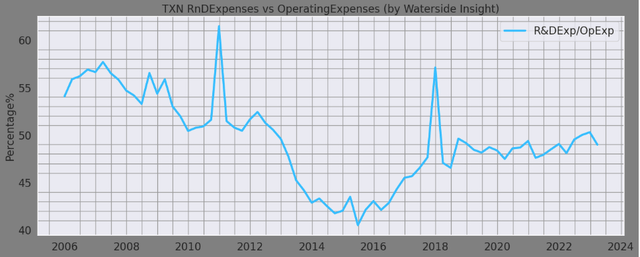
The emphasis on strong R&D spending ensures its technological lead in innovation is maintained and is, as the company stated, the key to its accretive future free cash flow. By placing around 45% to 50% of its operating expenses on R&D, technological innovation is obviously a higher priority over administrative and marketing spending, as it has always been emphasized.
txn (txn)
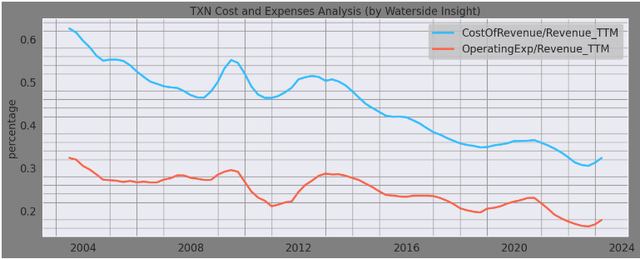
These research and development efforts also connect with the fact that Texas Instruments does most of its manufacturing in-house. The results are astounding. It essentially has almost halved both its cost of revenue and operating expenses with respect to its revenue in less than 20 years of time.
txn (txn)
Weakness/Risks
A lower trending free cash flow margin is an evident departure from other margins. It looked like the free cash flow margin plateaued in 2021 and started a decline afterward. This contrasted with impressive gross profit margin growth, up from just about 50% to currently 68% in ten years’ time.
txn (txn)
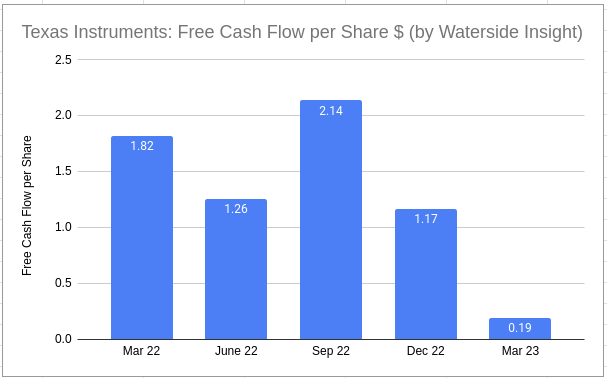
From the executive summary of its Capital Management presentation, Texas Instruments stated that “growing free cash flow per share is its primary driver of long-term value”. This departure is obviously against their long-term core value, financial-wise. And on a quarterly basis, Q1 of 2023 is at 19 cents, much lower than the previous quarters. Its TTM free cash flow per share by the end of last year was $6.4, and now it is $4.77, also lower than its past five years’ average annual free cash flow per share of $6.24. Unless the drawdown of its free cash flow is to serve the next goal on the capital allocation list – shareholder return. It is exactly what happened here – in 2022, the company returned about $7.9 billion in dividends and stock purchases combined. Its target for 2023 is to achieve a free cash flow margin of 25-35%, from currently about 22%, which was about its average before 2014. This goal isn’t lofty, and it should be within reach.
txn (txn)
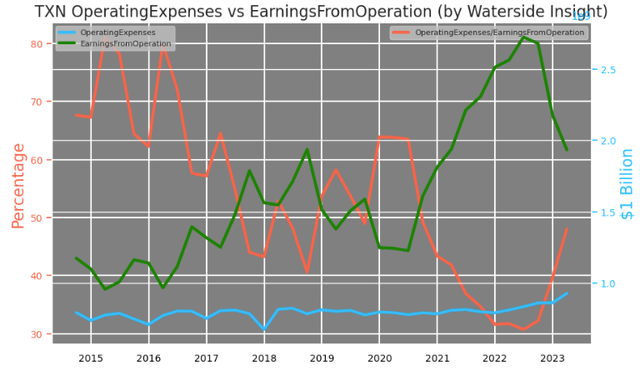
Looking at its operating expense, they have risen from 30% to around 50% as a percentage of earnings from operations, which is the average before the pandemic for the company. It’s not an alarming number, given its history. This rise isn’t due to a sudden increase in operating expenses but rather a drop in its earnings from the operation – declining from its peak of $2.7 billion in Q2 2022 to about $1.9 billion in the last quarter.
txn (txn)
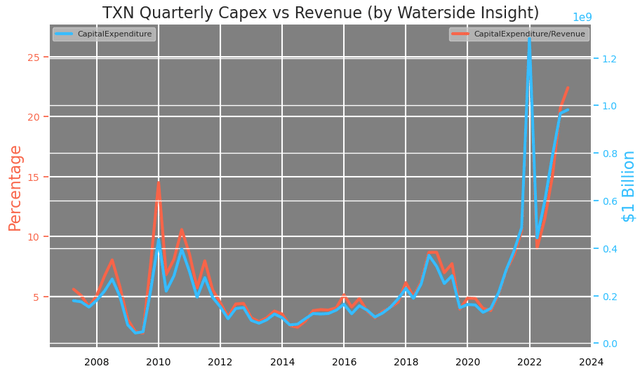
High capital expenditure spending in recent years. Capex has reached over 20% of the revenue by the last quarter. Again referring back to its Capital Management presentation,
txn (txn)
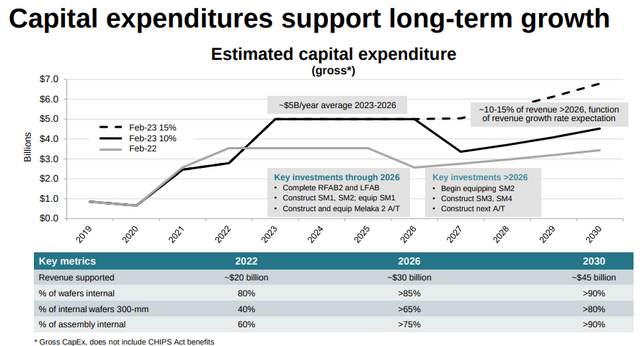
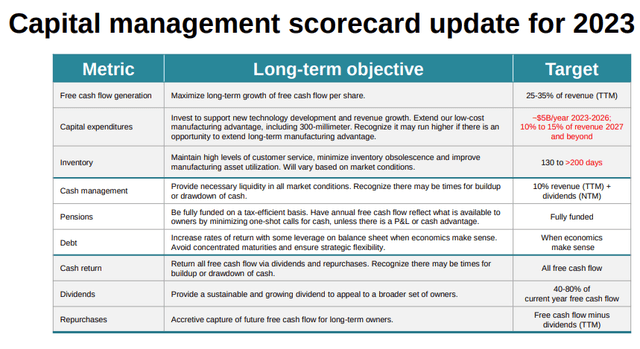
The company indicated that it would raise Capex if there was an opportunity to invest in its future growth advantages. Given its focus on extending its 300-mm cost advantage in these chips and strengthening its supply chain, the company has set a target for this spending to remain substantial: $5 billion per year for the next three years and then at 10-15% of revenue after that.
txn (txn)
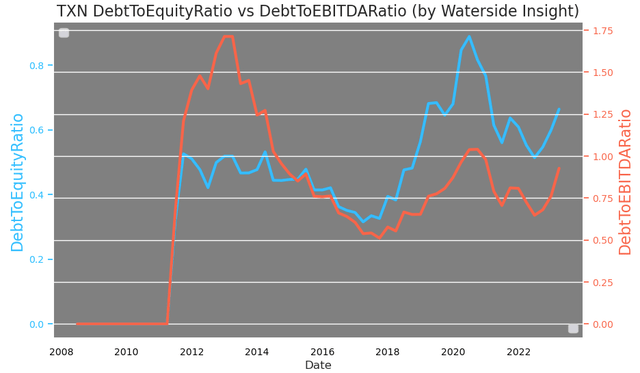
Its debt-to-equity ratio has risen faster than the debt-to-EBITDA ratio, with the latter approaching 100% once again since the pandemic.
txn (txn)
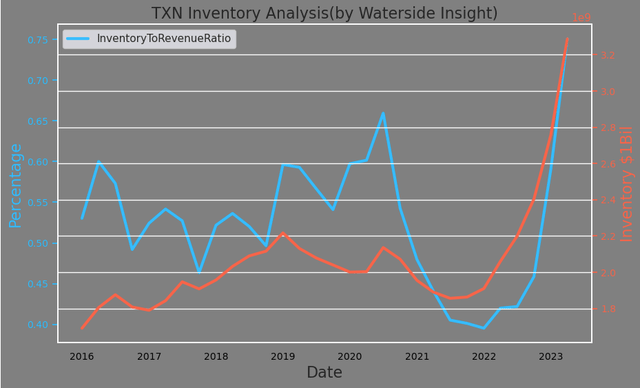
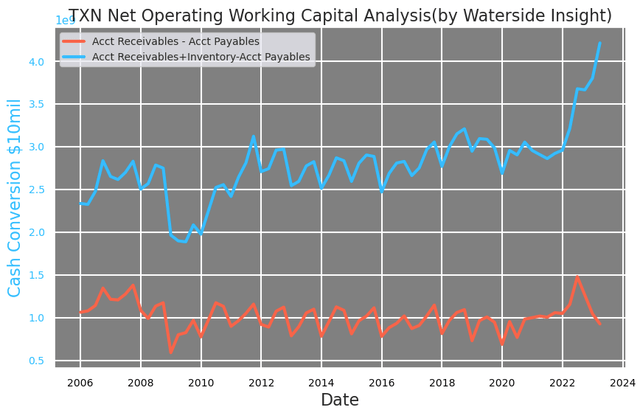
The company also has a high inventory that has quickly accumulated since late last year. It has reached the highest levels both in absolute value and as a percentage of the revenue. Bringing down the inventory is being noted as one of the prorates in 2023.
txn (txn)
In fact, inventory has taken up a larger part of the cash conversion, even with the difference between account receivables and account payables declining in the last few quarters.
txn (txn)
In reviewing Texas Instruments’ capital management target for 2023, we can see the areas in which it will most likely make efforts are free cash flow generation, inventory reduction, and perhaps dialing down its CapEx to some degree. Its days of inventory was at about 182 days in Q1, and it could expect to rise up to above 200 days within its target.
txn (txn)
Overall, Texas Instruments has a long history of discipline in implementing its capital allocation strategy with consistent cash return to shareholders, investing in CapEx to boost future growth. Still, we see signs of a slowdown in sales and earnings emerging.
Financial Overview

txn (txn)
Valuation
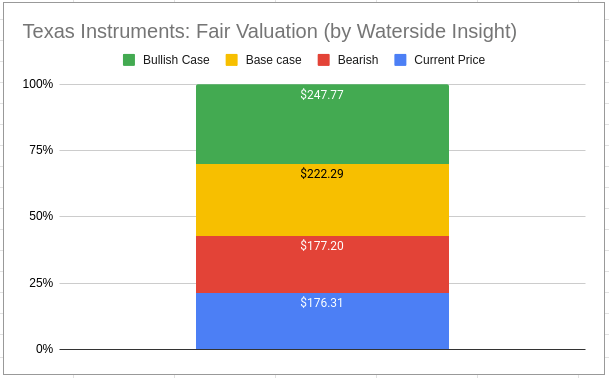
Considering everything analyzed above, we used our proprietary models to assess Texas Instruments’ fair value by projecting a ten-year horizon forward. In our bullish case, the company is going to meet its 2023 free cash flow target with challenges coming more in ’24, which will have negative free cash flow growth; it was priced at $247.77. In our bearish case, it will take about two years for it to flatten its current high inventory level on top of macroeconomic challenges, so a deeper slowdown in its cash flow generation comes in ’24 and ’25; it was priced at $177.2. In our base case, we simply took the middle ground in our expectation of the slowdown in ’24 and ’25 from our bullish and bearish case; it was priced at $222.29.
txn (txn)
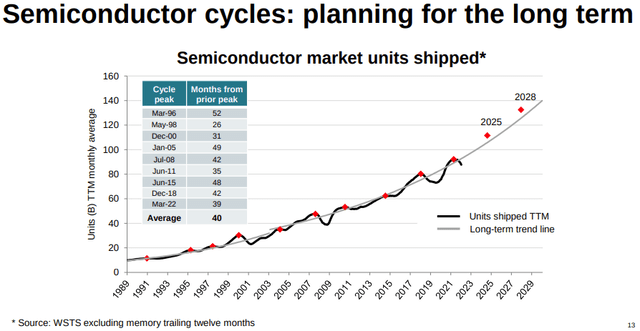
The long term growth of semiconductors is on track to grow by another 55% within the next five years. Texas Instruments continues to position itself to benefit from this trend. But it is right for the market to price in the near-term weakness, as the current price is on the bearish side in comparison with our fair valuation.
txn (txn)
Conclusion
Texas Instruments has been a leader in “making electronics more affordable through semiconductors” for decades. The company has been able to achieve stable financial results by generating strong cash flow along with substantial shareholder returns. However, the slowdown in sales, rise of inventory, higher capex spending could contribute to slower free cash flow generation. The market is a hair lower than our bearish fair value, and we recommend a hold.
Read the full article here


