As American Express Company (NYSE:AXP) seizes the potential of the booming global e-commerce sector, it presents a compelling case for long-term investment. The third-largest payments processor is in a prime position to capitalize on the online shopping trend, fuelling revenue growth from merchant fees and credit card usage. This piece provides a technical analysis of American Express’ stock price, aiming to predict its future trajectory. The market seems to have hit a trough at the sturdy support level provided by the 38.2% Fibonacci retracement. However, the stock price currently confronts the formidable hurdle of an ascending broadening wedge. This situation could induce further market consolidation, potentially driving the stock price lower before an upward breakout ensues.
Viewing American Express as a Long-term Investment Prospect
American Express possesses several strong characteristics which position it as a potentially rewarding long-term investment. However, certain near-term factors could lead to fluctuations in its stock price, signaling a potentially bearish trend in the short term. American Express is ideally positioned to capitalize on the ongoing global e-commerce boom. As the third-largest payments processor by market value, it is set to benefit from an increasing number of people shopping online and consequently using credit cards more frequently. This strategic alignment with long-term trends, common among companies that consistently grow their revenue, profit, share price, and dividend over time, is a strong factor in favor of investing in American Express.
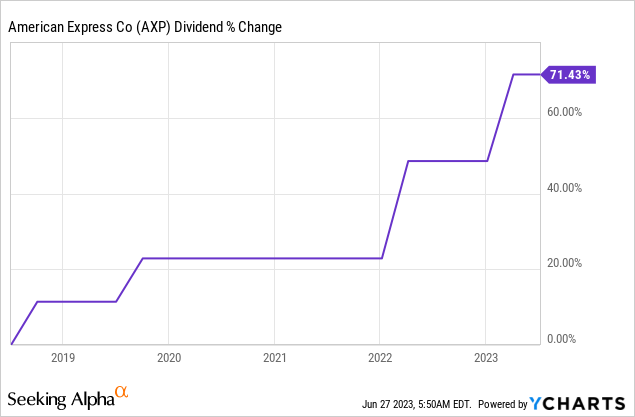
In recent results, American Express reported the acquisition of 3.4 million new cards and record levels of account acquisitions in various segments. The company’s fastest-growing demographics are millennials and Gen Z, evidencing its strategy of targeting younger consumers is paying off. Furthermore, American Express derives significant revenue from merchant fees charged whenever a customer uses one of its cards. With a double-digit percentage growth in payment volume, it saw a boost in revenue during the last year. Despite its dividend yield being below the Dow Jones average, American Express is a dividend growth play. The company’s dividend payout ratio is expected to be just under 21% in 2023, providing ample capital for future growth opportunities, balance sheet strengthening, and increases in distributions to shareholders. The chart below presents the dividend for American Express which shows a 71.43% growth during the last five years. Furthermore, its shares, which have gained more than 15% in the past 12 months, offer a compelling value, with a forward price-to-earnings ratio well below the industry’s average.

Despite its long-term prospects, American Express could face near-term challenges. Notably, a recent analyst report from Citigroup put the company on a 90-day negative catalyst watch due to expected short-term headwinds. The report cites an anticipated slowdown in travel and entertainment spending, a significant revenue center for the company, as the primary reason for the warning. While this analyst prediction may have caused a temporary dip in the stock price, it is just one perspective, and investors should consider the overall consensus. Nevertheless, this bearish outlook in the short term could lead to a decline in the stock price, offering potential investors a more favorable buying opportunity in the future.
Growing Bearish Pressure on American Express
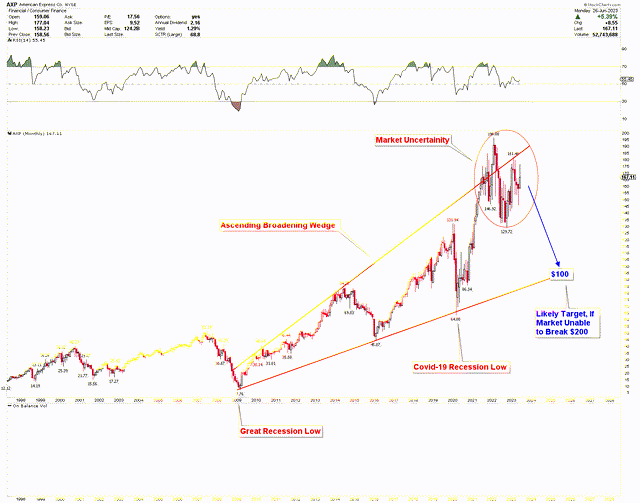
The technical panorama for American Express is indicative of an escalating bearish pressure in the market. As depicted by the monthly chart below, an ascending broadening wedge pattern emerges, demonstrating strong market volatility. The price currently trades at a crucial resistance area defined by this pattern, exhibiting significant uncertainty with a broad range between $196 and $129. This market ambiguity at the key resistance spot accentuates the bearish pressure, suggesting a possible market downturn before the next upswing.
Historically, during the last two recessions – the Great Recession and the Covid-19 downturns, the market experienced a decline. If a recession recurs in the near term, American Express has the potential to witness a dip to complete the ascending broadening wedge pattern. The wedge line of this pattern around $100 may serve as robust support for long-term investors considering American Express.
American Express Monthly Chart (stockcharts.com)
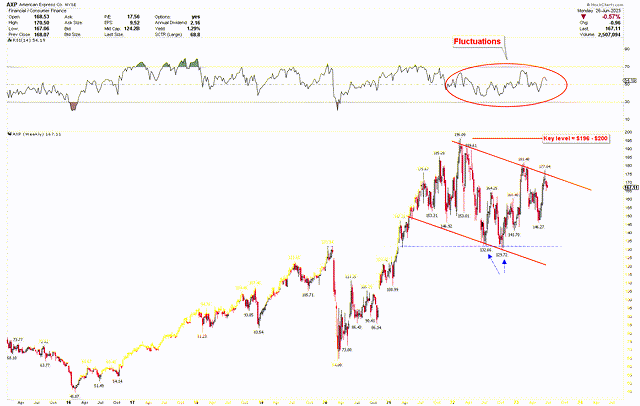
The weekly chart below showcases a channel defined by red trend lines, indicating the current price range. The upward surge in the market from the blue dotted line traces its origin to a market low followed by a recovery. This rapid price rise might be due to the double bottom occurrence at the blue dotted line. Observations of the RSI show no signs of overbought or oversold situations since the first quarter of 2021, implying a period of market stabilization. Moreover, the $200 level is pivotal in this scenario, where any breach above this level could lead to a significant rally in the market.
American Express Weekly Chart (stockcharts.com)
A Closer Look at Key Market Levels
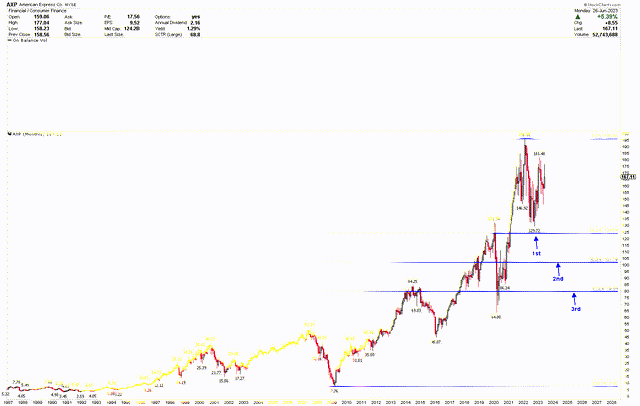
The ongoing consolidation poses a significant challenge for investors in identifying opportune entry points. The monthly chart below showcases a Fibonacci retracement from the Great Recession low to the all-time high. The chart reveals that American Express’s stock price peaked at $196.08 and fell to a 38.2% Fibonacci retracement, generating a strong buy signal. Typically, a buy is triggered at the 38.2% retracement during a bullish trend. However, considering the strong resistance at the ascending broadening wedge from the previous chart, further consolidation or market decline seems possible.
If American Express continues to drop and breaches the 38.2% level at $124, the price will likely persist in its descent toward the 50% retracement level at $101.79. This level presents a lucrative buying opportunity for long-term investors. Interestingly, the $101.79 level coincides with the support region of the ascending broadening wedge line discussed earlier, making it a pivot for long-term investors looking for a lower entry point into American Express.
American Express Monthly Chart (stockcharts.com)
Evaluating the Risk of Upside
Currently trading at a resistance zone, American Express may continue to ascend if the price surpasses the $196 to $200 threshold. Given the company’s robust financial record and recent consumer demand surge for online shopping, the long-term outlook for American Express remains bullish. Moreover, the price has already rebounded from the 38.2% retracement level, the first support. If the price remains above $124, this support could also serve as a long-term foothold. Additionally, the price marked a double bottom at $132.66 and $129.72 before establishing the support region, indicating bullish signals for investors. These bullish patterns will be validated only if the price breaks above $200.
Final Thoughts
In the landscape of financial investments, American Express paints a fascinating picture. Its potential as a long-term investment, anchored by its pivotal role in the e-commerce boom and successful engagement with younger consumers, is significant. Indeed, the company’s record card acquisitions and robust revenue growth underscore this potential.
However, the journey toward long-term gains may be punctuated with short-term turbulence. Forecasts of a slowdown in travel and entertainment spending, coupled with an analyst’s bearish outlook, suggest potential dips shortly. Yet, these dips could present opportune moments for investors to make their move. Moreover, the technical analysis highlights possible market downturns, it also sheds light on potential rebounds and rallies, serving as a guidepost for astute investors. The significant market turbulence seen at the resistance point of the ascending broadening wedge suggests potential price drops. If the price breaks above the $200 threshold, this would counteract the short-term bearish perspective, leading to a continued price surge. If downward momentum builds over the coming weeks, investors may find a prime buying opportunity in American Express. A robust pivot point for making a long-term investment in the stock is at the $100 mark.
Read the full article here


