Overview
In the wake of the failure of Signature Bank (OTCPK:SBNY) this spring, one regional bank emerged to take it over, under the watchful eyes & coordination of the FDIC, and now is worth keeping on an investor watchlist in my opinion.
That bank’s name?
New York Community Bancorp (NYSE:NYCB)
Today’s analysis deep dives into this bank, which I gave a Buy Rating today.
Its positives include a strong dividend yield among peers, undervaluation on P/E and P/B, strong capital & liquidity, revenue & geographic diversification, and a business model that benefits from the macro environment of high interest rates driven by Fed rate decisions.
Holding it back somewhat is that I think its current price trend seems overbought, trading well above its 200 day SMA as of Friday’s close.
Company Brief
Interestingly enough, this bank actually traces its roots to 1859 in the New York City area, today operating through subsidiaries including Flagstar Bank and New York Community Bank.
Not known for huge media coverage before, this company made headlines this spring when “on March 19, 2023, NYCB acquired $38.4 billion in assets from the liquidated Signature Bank in a $2.7 billion deal, with 40 Signature branches being converted to Flagstar locations.”
What is also notable to mention is that this bank got a “good deal” in the takeover process both for its company and shareholders. This was echoed by SA Analyst Patrik Mackovych in his May 30th analysis:
the FDIC must identify a financially sound and secure institution. If the acquirer selects solid assets after completing these steps, these types of transactions can result in significant growth for the acquirer. Typically, the bank obtained a large proportion of healthy assets and liabilities at a substantial discount.
Rating Methodology
Our rating consists of evaluating 5 areas: dividend yield, valuation & price chart trends, the company’s revenue & geographic diversification, capital & liquidity strength, and whether the current macro environment helps or hurts their business. Each category is worth 20 points. A total score of 60 is a hold rating, below 60 is a sell, above 60 is a buy. A 100% would be a strong buy.
A Dividend Yield at 6.5%
One glance at Seeking Alpha’s dividend info for this stock, and what grabs my attention is the almost 6.5% dividend yield!
New York Community Bancorp – Dividends (Seeking Alpha)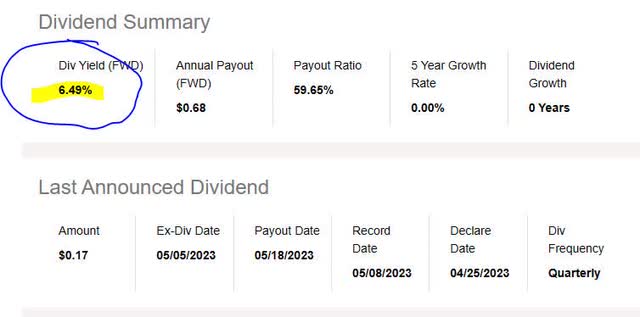
In addition, for the dividend investor, what is notable is this bank has managed to keep its annual dividend of $0.68 the same for 5 years, without cutting it or stopping quarterly payments to shareholders. This tells me it has the capacity to return capital back to shareholders on a regular basis, which is a positive sign going forward as well.
NYCB – 5 years dividend growth (Seeking Alpha)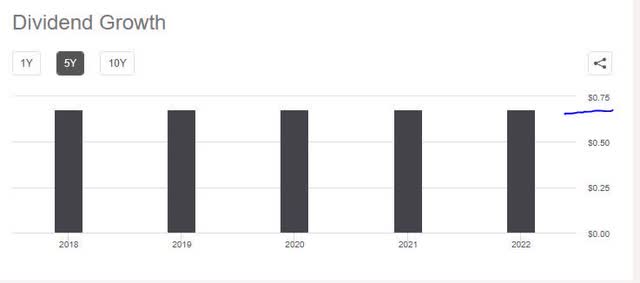
In comparison with two of its listed peers, First Horizon (FHN) and Cullen/Frost Bankers (CFR), the latter being the parent company of Texas’ Frost Bank, this stock wins among the three on dividend yield. Consider that the dividend yield for First Horizon is 5.45%, and for Cullen/Frost it is a dividend yield of 3.36%.
Therefore, yes I think this stock is competitive among peers as a stock to add to one’s dividend-income portfolio.
An Undervaluation Opportunity waiting on next Price Dip
Next, let’s talk valuation. The data I am referencing is the forward Price to Earnings Ratio and the forward Price to Book Ratio, taken from Seeking Alpha.
I am tracking the P/E, which is currently at 2.73, and has gotten an A+ grade from Seeking Alpha, as well as being almost 70% below the median for this sector. In addition, it is far below the S&P 500 median P/E of 14.93.
NYCB – P/E ratio (Seeking Alpha)
When it comes to tracking the P/B ratio, it is currently below 1.0, which is the benchmark I use to gauge under or overvaluation. In this case, it is undervalued at a P/B of 0.71 and also 25% lower than the median for its sector.
NYCB – PB ratio (Seeking Alpha)
Although the stock appears undervalued, next let’s look at the current price chart as of the last market close.
Below, is the price chart for this stock as of market close on Friday June 23rd, with a last close at $10.47.
NYCB – price chart June 23 (StreetSmartEdge trading platform from Charles Schwab)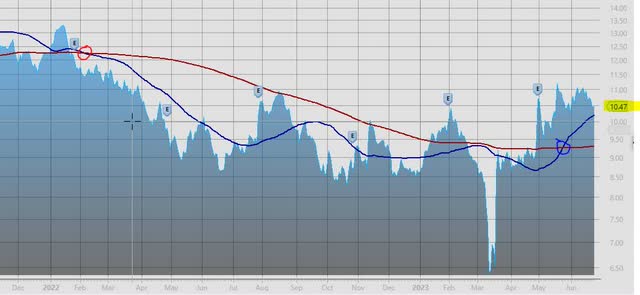
In this chart, I am tracking the 50 day SMA (blue line) vs the 200 day SMA (red line), as in my prior analyses, and following where the 50 day crosses above or below the 200 day, and formation of lagging indicators of bullish or bearish trends.
In looking at this chart, if an investor had bought during the March dip at around $7, by now they could have realized a near 50% gain on those shares.
By now, it is trading well above its 200 day SMA and looks to me to be overbought somewhat, although the price could be reversing downward again as well.
So although its P/E and P/B valuations look great, no I don’t think the current price is the best value although it is not bad either.
I prefer for another dip to occur and death cross formation, to add some of this stock to an existing portfolio of bank stocks that include some of the big banks as well in order to spread portfolio risk, limiting exposure to regionals at this time to only a certain percentage of a portfolio.
A Bank With Revenue & Geographic Diversification
Sometimes the phrase “regional bank” can be misleading, especially when some regionals have been penetrating broader markets.
This seems to be the case with this bank. Although it has deep roots in the New York City area, its major subsidiary Flagstar Bank has over 400 branches “including strong footholds in the Northeast and Midwest and exposure to high growth markets in the Southeast and West Coast”, according to company commentary.
Other notable geographic mentions are: the Company is the second-largest multi-family portfolio lender in the country, the industry’s 6th largest sub-servicer of mortgage loans nationwide, 2nd largest mortgage warehouse lender nationally based on total commitments.
In terms of revenue diversification, although interest income is the primary bread & butter for this company, they also have been doing well with non-interest income as well.
For instance, based on company info, some of their non interest income includes gain loan sales, net return on mortgage servicing rights, and net loan administration income, all of which have improved QoQ.
NYCB – Q1 results – non interest income (NYCB Q1 results release)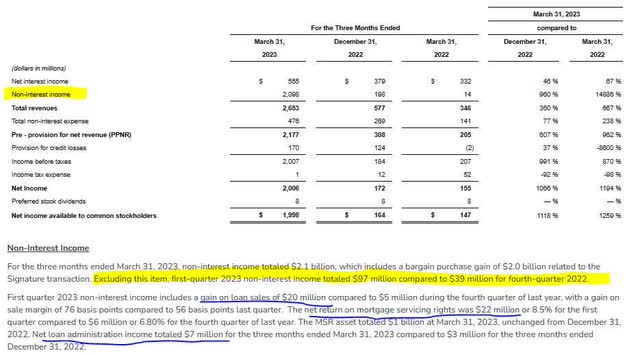
For this reason, I am calling a Yes on the question of geographic & revenue diversification, as this company clearly has both.
Capital and Liquidity are Strong
Although this is a smaller, regional bank, it does not automatically mean it is worse off in terms of capital than some of the bigger players.
One of the key metrics I am tracking is the CET1 ratio, and the benchmark 4.5% minimum per Basel III standards.
What is notable, from their Q1 results, is that they have a CET1 ratio of 9.29%.
NYCB – Q1 results – capital (NYCB)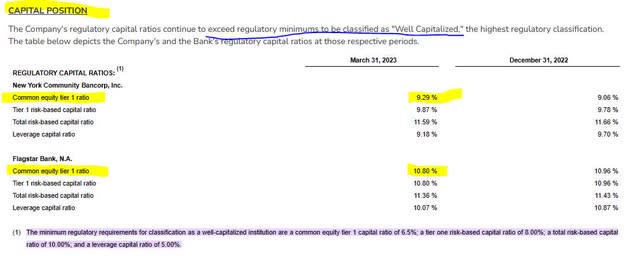
In terms of liquidity, its quarterly presentation highlighted its borrowing capacity at the Fed and FHLB, and available liquidity totalling $42.2B.
NYCB – liquidity (NYCB)
By comparison with much larger banks, this bank having a CET1 ratio of 9.29% puts in among the likes of Truist Financial (TFC) and PNC Financial (PNC), which had similar ratios last year based on Q2 2022 info from Statista:
CET1 ratio of largest US banks – 2022 (Statista)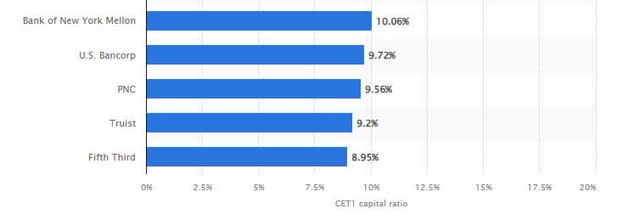
Further, its cash flow statement shows positive cashflow, and its balance sheet shows positive equity.
Based on the above data, yes the company is in both a strong capital and liquidity position, which are important metrics to track a bank’s risk of insolvency.
A Favorable Macro Environment – Higher Interest Rates
This bank, like many others, have benefited from interest income, and the environment of higher rates. The latest sentiment from rate traders, based on CME Fedwatch data, is another rate hike in July:
CME Fedwatch – rate hike probability (CME Fedwatch)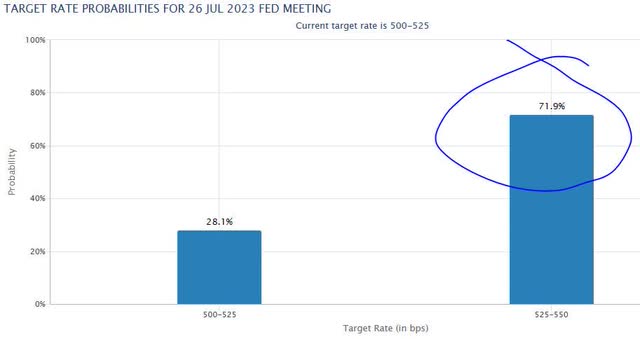
I would argue this bank has benefited from this extended period of high interest rates due to Fed decisions.
Consider that from their Q1 results, their NII rose 46% QoQ, and NIM was up 32 bp QoQ. Additionally, the average yield rose to 4.80% on their interest earning assets.
NYCB – Q1 results – NII and NIM (NYCB)
Further, consider the table below from their recent income statement, showing what appears to be a 67% increase YoY in NII, as well as a steady upward trend in NII since Sept 2021, a much lower rate environment in macro terms.
NYCB – NII trend since 2021 (Seeking Alpha)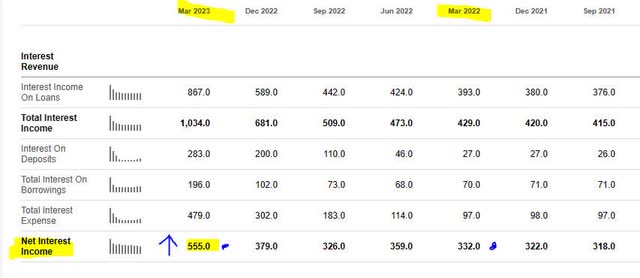
Therefore, yes the current macro environment of higher interest rates driven by Fed decisions has benefited this business, and from a forward looking view if rate traders are correct then we could see more of the same this year, and this could correlate to continued NII growth for this bank’s income statement for the balance of the year. As an equities analyst, this is a positive sign to look forward to as someone covering the banking sector.
Risks to my Outlook
One potential risk to my bullish outlook on this stock is that Wall Street grows concerned about the credit risk exposure this bank has on its books, and jittery investors avoid buying this bank for that reason. The other potential risk is the amount of uninsured deposits this bank holds, since as we saw in March those types of deposits are more prone to bank runs, after the Silicon Valley Bank failure.
In terms of the credit risk, I can say from the company’s own recent quarterly remarks that they seem to be managing well, with non performing loans barely 0.20% of total, and no net charge-offs in Q1, along with a declining trend in net charge-offs since Q12022.
NYCB – asset quality (NYCB)
In terms of uninsured deposits, according to the bank’s quarterly presentation: “uninsured deposits, net of collateralized deposits, total $28.7 billion or approximately 34% of total deposits.”
So, over 60% of their deposits are insured.
By contrast, according to a Time magazine story, “more than 85% of the bank’s (Silicon Valley Bank) deposits were uninsured, according to estimates in a recent regulatory filing.”
My counterargument to a jittery Wall Street, therefore, is that although credit & deposit risk are important things to keep an eye on in the next few quarters at the regional banks, at this time it appears those risks are under control at this specific bank, and it is also not exposed to the level of uninsured deposits that led to some of the spring bank failures.
Conclusion
In conclusion, my rating of Buy is in line with the sentiment of Seeking Alpha analysts as well as Wall Street which both gave this stock a Buy rating, as shown below, but my rating is more bullish than Seeking Alpha’s quant system which gave it a Hold rating.
Comparison of ratings (Seeking Alpha)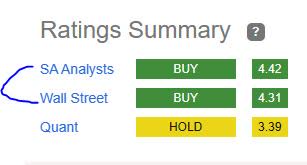
To reiterate, my rating is not a Strong Buy because I think there could be a price-dip opportunity if one waits for the next death cross formation, as I like this stock in the under $10 range.
This bank’s positives are dividend yield at 6.5%, strong capital, undervaluation on P/E and P/B, revenue & geographic diversification, and a favorable interest rate environment from a macro perspective as long as the Fed keeps rates the same or higher for a longer period… helping drive NII and NIM.
The bank’s price chart from Friday shows it trading well above its 200 day SMA, however, which is starting to make it look overbought.
In closing, this is yet another of the regionals I added to my watchlist because it has strong financial fundamentals along with potential value buying opportunity, and the dividend yield itself is great reason to add a modest position in this stock to an existing portfolio of dividend-income bank stocks.
Read the full article here


